
MATLAB: An Introduction with Applications
6th Edition
ISBN: 9781119256830
Author: Amos Gilat
Publisher: John Wiley & Sons Inc
expand_more
expand_more
format_list_bulleted
Related questions
Question

Transcribed Image Text:Question 9
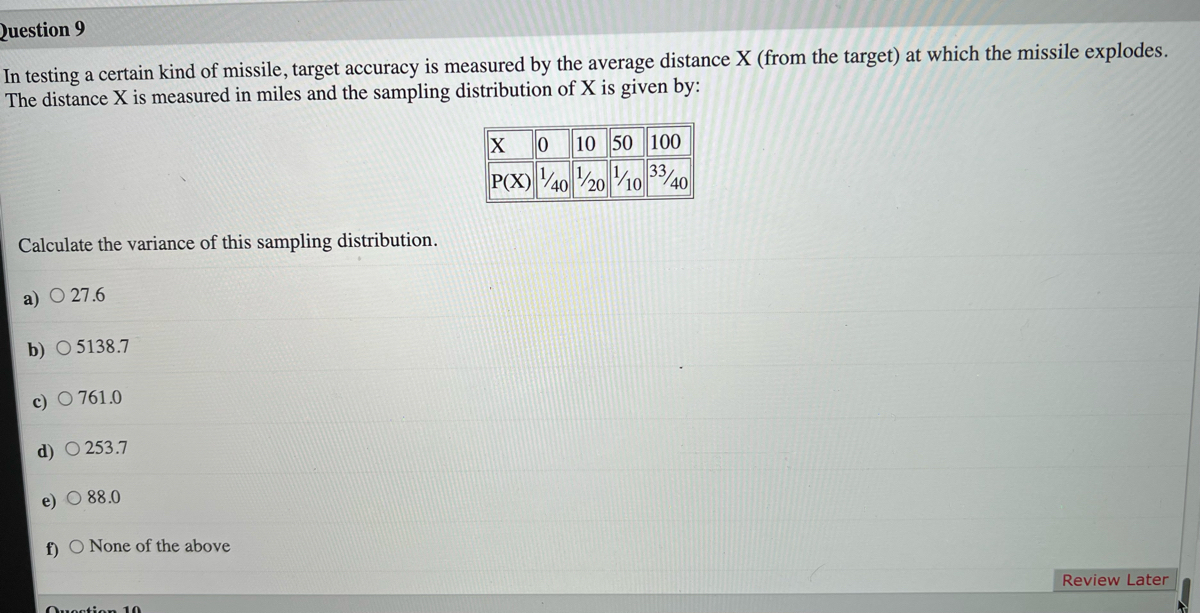
In testing a certain kind of missile, target accuracy is measured by the average distance X (from the target) at which the missile explodes.
The distance X is measured in miles and the sampling distribution of X is given by:
10 50 100
P(X) 40 20 V1040
33
Calculate the variance of this sampling distribution.
a) O 27.6
b) O 5138.7
c) O 761.0
d) O 253.7
e) O 88.0
f) O None of the above
Ouoction 10
Review Later
Expert Solution
This question has been solved!
Explore an expertly crafted, step-by-step solution for a thorough understanding of key concepts.

This is a popular solution

Trending nowThis is a popular solution!

Step by stepSolved in 2 steps

Knowledge Booster

Similar questions
- Calculate the Variance using the following information: EXi = ΣΧ2 = n 32.3 413.8 18 Round your answer to the nearest hundredth. (Place your answer in the box below)arrow_forwardIf actual period demand varies from the forecast by more than 3MAD, this indicates: there is 3% chance that the forecast is wrong. there is a 98% chance that the forecast is wrong. there is a 97% chance that the forecast is wrong. there is a 3% chance that the forecast is correct Moving to the next question prevents changes to this answer:arrow_forward1. Compute the variance of the number of boats sold daily (show your calculation prices in a table) 2. Compute the standard deviation of the number of boats sills daily.arrow_forward
- In order to use the defining formula for variance, we must calculate (x − x)2 for each data value in the data set 14, 18, 22, 26, 33. Use the values in the data set and the mean x = 22.6 to fill out the following table. x 14 18 22 26 33 x 22.6 22.6 22.6 22.6 22.6 x − x 14 − 22.6 = −8.6 18 − 22.6 = __________ 22 − 22.6 = −0.6 26 − 22.6 = _________ 33 − 22.6 = 10.4 (x − x)2 73.96 __________ 0.36 ________ 108.16arrow_forwardCalculate the coefficient of variation of a distribution with: 2*f = 110 and *² · f = 1235 n = 10, %3D %3D 1.596 75.496 15.2% 25.3%arrow_forwardIn testing for the differences between the means of two independent populations where the variances in each population are unknown but assumed equal, the degrees of freedom are Seleccione una: OA. n- 1. O B. m + n2 - 1. OC. n- 2. OD. m + n2 - 2.arrow_forward
arrow_back_ios
arrow_forward_ios
Recommended textbooks for you
- MATLAB: An Introduction with ApplicationsStatisticsISBN:9781119256830Author:Amos GilatPublisher:John Wiley & Sons Inc
 Probability and Statistics for Engineering and th...StatisticsISBN:9781305251809Author:Jay L. DevorePublisher:Cengage Learning
 Statistics for The Behavioral Sciences (MindTap C...StatisticsISBN:9781305504912Author:Frederick J Gravetter, Larry B. WallnauPublisher:Cengage Learning
  Elementary Statistics: Picturing the World (7th E...StatisticsISBN:9780134683416Author:Ron Larson, Betsy FarberPublisher:PEARSON
 The Basic Practice of StatisticsStatisticsISBN:9781319042578Author:David S. Moore, William I. Notz, Michael A. FlignerPublisher:W. H. Freeman
 Introduction to the Practice of StatisticsStatisticsISBN:9781319013387Author:David S. Moore, George P. McCabe, Bruce A. CraigPublisher:W. H. Freeman
MATLAB: An Introduction with Applications
Statistics
ISBN:9781119256830
Author:Amos Gilat
Publisher:John Wiley & Sons Inc
Probability and Statistics for Engineering and th...
Statistics
ISBN:9781305251809
Author:Jay L. Devore
Publisher:Cengage Learning
Statistics for The Behavioral Sciences (MindTap C...
Statistics
ISBN:9781305504912
Author:Frederick J Gravetter, Larry B. Wallnau
Publisher:Cengage Learning
Elementary Statistics: Picturing the World (7th E...
Statistics
ISBN:9780134683416
Author:Ron Larson, Betsy Farber
Publisher:PEARSON
The Basic Practice of Statistics
Statistics
ISBN:9781319042578
Author:David S. Moore, William I. Notz, Michael A. Fligner
Publisher:W. H. Freeman
Introduction to the Practice of Statistics
Statistics
ISBN:9781319013387
Author:David S. Moore, George P. McCabe, Bruce A. Craig
Publisher:W. H. Freeman