
MATLAB: An Introduction with Applications
6th Edition
ISBN: 9781119256830
Author: Amos Gilat
Publisher: John Wiley & Sons Inc
expand_more
expand_more
format_list_bulleted
Related questions
Question
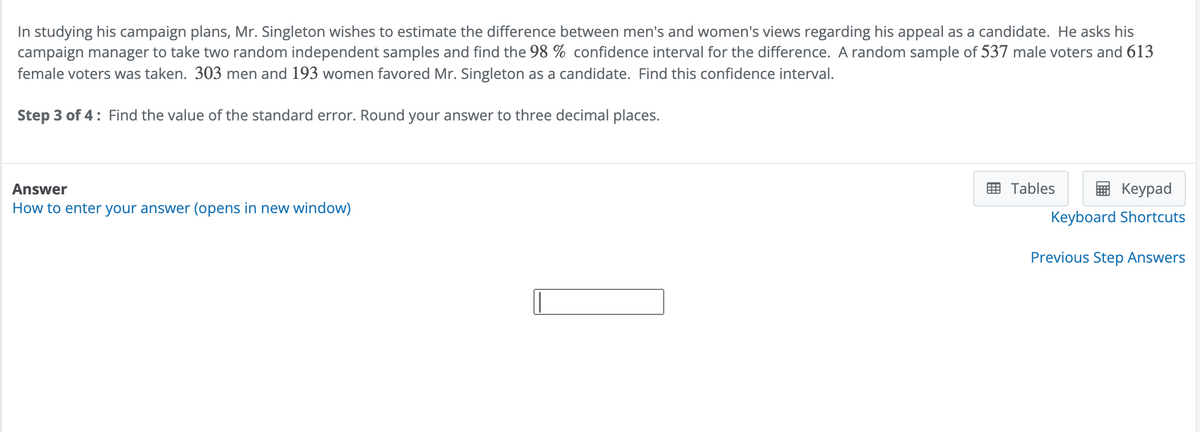

Transcribed Image Text:In studying his campaign plans, Mr. Singleton wishes to estimate the difference between men's and women's views regarding his appeal as a candidate. He asks his
campaign manager to take two random independent samples and find the 98 % confidence interval for the difference. A random sample of 537 male voters and 613
female voters was taken. 303 men and 193 women favored Mr. Singleton as a candidate. Find this confidence interval.
Step 3 of 4: Find the value of the standard error. Round your answer to three decimal places.
Answer
How to enter your answer (opens in new window)
Tables
Keypad
Keyboard Shortcuts
Previous Step Answers
Expert Solution
This question has been solved!
Explore an expertly crafted, step-by-step solution for a thorough understanding of key concepts.

This is a popular solution

Trending nowThis is a popular solution!

Step by stepSolved in 6 steps with 16 images

Knowledge Booster

Similar questions
- A political candidate has asked you to conduct a poll to determine what percentage of people support her. If the candidate only wants a 9% margin of error at a 90% confidence level, what size of sample is needed?arrow_forwardA research institute poll asked respondents if they felt vulnerable to identity theft. In the poll, n=935 and x=561 who said "yes." Use a 95% confidence level.arrow_forwardFor a class project, a political science student at a large university wants to estimate the percent of students who are registered voters. He surveys 500 students and finds that 300 are registered voters. Compute a 90% confidence interval for the true percent of students who are registered voters, and interpret the confidence interval. Round your answer to nearest thousandth if necessary. Interpret the result.arrow_forward
- Tables Keypad Keyboard Shortcuts In studying his campaign plans, Mr. Singleton wishes to estimate the difference between men's and women's views regarding his appeal as a candidate. He asks his campaign manager to take two random independent samples and find the 98 % confidence interval for the difference. A random sample of 537 male voters and 613 female voters was taken. 303 men and 193 women favored Mr. Singleton as a candidate. Find this confidence interval. Step 1 of 4: Find the values of the two sample proportions, 1 and 2. Round your answers to three decimal places. Answer How to enter your answer (opens in new window) P1 P2 IIarrow_forwardExample 8.11 For a class project, a political science student at a large university wants to estimate the percent of students who are registered voters. He surveys 500 students and finds that 300 are registered voters. Compute a 90% confidence interval for the true percent of students who are registered voters, and interpret the confidence interval.arrow_forwardConstruct a 95% confidence interval for p1 - p2 for a survey that finds 30% of 240 males and 41% of 200 females are opposed to the death penalty. Group of answer choices a.(-0.200, -0.021) b.(-1.532, 1.342) c.(-1.324, 1.512) d.(-0.561, 0.651)arrow_forward
- The dean of students at a large college is interested in learning about their opinions regarding the percentage of first-year students who should be given parking privileges in the main lot. He sends out an email survey to all students about this issue. A large number of first-year students reply but very few sophomores, juniors, and seniors reply. Based on the responses he receives, he constructs a 90% confidence interval for the true proportion of students who believe first-year students should be given parking privileges in the main lot to be (0.71, 0.79). Which of the following may have an impact on the confidence interval, but is not accounted for by the margin of error? response bias O nonresponse bias O sampling variation O undercoverage biasarrow_forwardVlad the Impaler promotes many of his soldiers into generals (don't ask what happened to the past generals). Haley thinks the proportion is about 79%, but wants to estimate the proportion better by sampling soldiers until her margin of error for a 93% Confidence Interval is less than 0.005. How many soldiers should Haley sample?arrow_forwardBeth wants to determine a 99% confidence interval for the true proportion of high school students in the area who attend their home basketball games. How large of a sample must she have to get a margin of error less than 0.04? Assume we have no prior estimate of the proportion and want a conservative choice for the sample size. n =arrow_forward
- The last poll of 144 voters in Iowa shows that 19% of voters will vote for him in the Iowa Presidential Caucus. What is the 99% confidence interval of his support level in Iowa?arrow_forwardMost married couples have two or three personality preferences in common. A random sample of 362 married couples found that 138 had three preferences in common. Another random sample of 552 couples showed that 218 had two personality preferences in common. Let p1 be the population proportion of all married couples who have three personality preferences in common. Let p2 be the population proportion of all married couples who have two personality preferences in common. (a) Find a 95% confidence interval for p1 – p2. (Use 3 decimal places.)lower limit =upper limit=arrow_forward
arrow_back_ios
arrow_forward_ios
Recommended textbooks for you
- MATLAB: An Introduction with ApplicationsStatisticsISBN:9781119256830Author:Amos GilatPublisher:John Wiley & Sons Inc
 Probability and Statistics for Engineering and th...StatisticsISBN:9781305251809Author:Jay L. DevorePublisher:Cengage Learning
 Statistics for The Behavioral Sciences (MindTap C...StatisticsISBN:9781305504912Author:Frederick J Gravetter, Larry B. WallnauPublisher:Cengage Learning
  Elementary Statistics: Picturing the World (7th E...StatisticsISBN:9780134683416Author:Ron Larson, Betsy FarberPublisher:PEARSON
 The Basic Practice of StatisticsStatisticsISBN:9781319042578Author:David S. Moore, William I. Notz, Michael A. FlignerPublisher:W. H. Freeman
 Introduction to the Practice of StatisticsStatisticsISBN:9781319013387Author:David S. Moore, George P. McCabe, Bruce A. CraigPublisher:W. H. Freeman
MATLAB: An Introduction with Applications
Statistics
ISBN:9781119256830
Author:Amos Gilat
Publisher:John Wiley & Sons Inc
Probability and Statistics for Engineering and th...
Statistics
ISBN:9781305251809
Author:Jay L. Devore
Publisher:Cengage Learning
Statistics for The Behavioral Sciences (MindTap C...
Statistics
ISBN:9781305504912
Author:Frederick J Gravetter, Larry B. Wallnau
Publisher:Cengage Learning
Elementary Statistics: Picturing the World (7th E...
Statistics
ISBN:9780134683416
Author:Ron Larson, Betsy Farber
Publisher:PEARSON
The Basic Practice of Statistics
Statistics
ISBN:9781319042578
Author:David S. Moore, William I. Notz, Michael A. Fligner
Publisher:W. H. Freeman
Introduction to the Practice of Statistics
Statistics
ISBN:9781319013387
Author:David S. Moore, George P. McCabe, Bruce A. Craig
Publisher:W. H. Freeman