
MATLAB: An Introduction with Applications
6th Edition
ISBN: 9781119256830
Author: Amos Gilat
Publisher: John Wiley & Sons Inc
expand_more
expand_more
format_list_bulleted
Related questions
Question
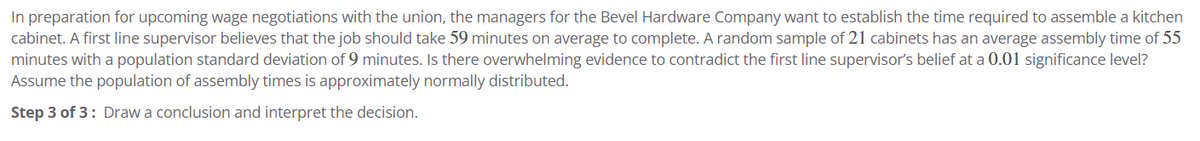

Transcribed Image Text:In preparation for upcoming wage negotiations with the union, the managers for the Bevel Hardware Company want to establish the time required to assemble a kitchen
cabinet. A first line supervisor believes that the job should take 59 minutes on average to complete. A random sample of 21 cabinets has an average assembly time of 55
minutes with a population standard deviation of 9 minutes. Is there overwhelming evidence to contradict the first line supervisor's belief at a 0.01 significance level?
Assume the population of assembly times is approximately normally distributed.
Step 3 of 3: Draw a conclusion and interpret the decision.
SAVE
AI-Generated Solution
info
AI-generated content may present inaccurate or offensive content that does not represent bartleby’s views.
Unlock instant AI solutions
Tap the button
to generate a solution
to generate a solution
Click the button to generate
a solution
a solution
Knowledge Booster

Similar questions
- 12.) The FAA has to periodically revise their rules regarding weight estimates. Airlines use anestimate for the weight of a passenger of 195 lbs. (an adult traveling in winter including 20 lbs.of baggage). According to your textbook, assume that men (not carrying baggage) have weightsthat are normally distributed with a mean of 188.6 lbs. and a standard deviation of 38.9 lbs.a.) If one adult male is randomly selected and is assumed to be carrying 20 lbs. carry-onbaggage, find the probability that the total weight is greater than 195 lbs.b.) What total weight would separate the lower 20% of men carrying 20 lbs. of baggage fromthe top 80%?arrow_forward1. The owner of a gas station which makes headlight inspections for the state is trying to decide whether or not to discontinue the service. He figures that to make the operation profitable, the station must average in excess of 15 inspections per week. Unless data indicates strongly that this is the case, inspections will be discontinued. Data for the past year (52 weeks) yields a sample average of 16.7 inspections per week with a sample standard deviation of 4.5. Is this strong enough evidence to cause the owner to retain the inspection service? Test the relevant hypotheses using the P-value method.arrow_forward2. A professional racing team is holding tryouts at its test track. The team requires its drivers to have an average lap time of at most 133 seconds at its test track. The team will use a one sample z-test of significance to determine if they should hire a new driver. An amateur driver completes 10 timed laps of the test track with an average lap time of 140 seconds. If the standard deviation of all lap times at this track is 4.5 seconds, what is the value of the test statistic? Round your answer to two decimal places. Answer value Please show work!!!arrow_forward
- According to a government agency, the average workweek for an adult in February 2018 was 34.1 hours. Assume the population standard deviation for the number of hours worked per week is 4.0 hours. A random sample of 35 adults worked an average of 34.8 hours last week.arrow_forward2. University researchers claim that the average enrollment at four-year colleges is higher than two-year community colleges. Two surveys are undertaken at 35 four-year universities and 35 two-year colleges. The mean enrollment at the four-year institutions was 5,466 with a standard deviation of 8,191. The average enrollment at the two-year schools was 5,068 with a standard deviation of 4,777. Using a 95% confidence level, are the findings of the surveys consistent with the university researchers’ claim? 2. Does the null hypothesis reject H0 or fail to reject H0?arrow_forward12) A state fish hatchery raises trout for stocking streams and lakes. The size of the fish at release time can be controlled to a fair degree by varying the rate of feeding. The target is a mean of 10 ounces; if the fish are too small, those who catch the fish aren’t happy. A random sample of 75 fish were weighed at time of release and it was determined that the mean was 9.66 ounces with a standard deviation of 0.86 ounces. Test to determine if the fish being released have a population mean less than 10 ounces at the 0.01 significance level.arrow_forward
- Question 6 Suppose A and B are two events with probabilities: Find the following: a) P(ANB). b) P(A). c) P(Bº). d) P((An B)*). Edit View Insert Format Tools Table 12pt v P(Aª) = .40, P(B) = .25, P(A U B) = .75. ✓ Paragraph BIUAT² : B Q Search Varrow_forwardThe mean annual salary for nurses is $65,000 with a standard deviation of $7,000. What is he probability that a randomly selected nurse has a salary less than $60,000? A random sample of 50 nurses is selected. What is the probability that the sample mean annual salary is less than $60,000?arrow_forwardA metropolitan transportation authority has set a bus mechanical reliability goal of 3,900 bus miles. Bus mechanical reliability is measured specifically as the number of bus miles between mechanical road calls. Suppose a sample of 100 buses resulted in a sample mean of 3,975 bus miles and a sample standard deviation of 275 bus miles. Complete parts (a) and (b) below.arrow_forward
arrow_back_ios
arrow_forward_ios
Recommended textbooks for you
- MATLAB: An Introduction with ApplicationsStatisticsISBN:9781119256830Author:Amos GilatPublisher:John Wiley & Sons Inc
 Probability and Statistics for Engineering and th...StatisticsISBN:9781305251809Author:Jay L. DevorePublisher:Cengage Learning
 Statistics for The Behavioral Sciences (MindTap C...StatisticsISBN:9781305504912Author:Frederick J Gravetter, Larry B. WallnauPublisher:Cengage Learning
  Elementary Statistics: Picturing the World (7th E...StatisticsISBN:9780134683416Author:Ron Larson, Betsy FarberPublisher:PEARSON
 The Basic Practice of StatisticsStatisticsISBN:9781319042578Author:David S. Moore, William I. Notz, Michael A. FlignerPublisher:W. H. Freeman
 Introduction to the Practice of StatisticsStatisticsISBN:9781319013387Author:David S. Moore, George P. McCabe, Bruce A. CraigPublisher:W. H. Freeman
MATLAB: An Introduction with Applications
Statistics
ISBN:9781119256830
Author:Amos Gilat
Publisher:John Wiley & Sons Inc
Probability and Statistics for Engineering and th...
Statistics
ISBN:9781305251809
Author:Jay L. Devore
Publisher:Cengage Learning
Statistics for The Behavioral Sciences (MindTap C...
Statistics
ISBN:9781305504912
Author:Frederick J Gravetter, Larry B. Wallnau
Publisher:Cengage Learning
Elementary Statistics: Picturing the World (7th E...
Statistics
ISBN:9780134683416
Author:Ron Larson, Betsy Farber
Publisher:PEARSON
The Basic Practice of Statistics
Statistics
ISBN:9781319042578
Author:David S. Moore, William I. Notz, Michael A. Fligner
Publisher:W. H. Freeman
Introduction to the Practice of Statistics
Statistics
ISBN:9781319013387
Author:David S. Moore, George P. McCabe, Bruce A. Craig
Publisher:W. H. Freeman