
MATLAB: An Introduction with Applications
6th Edition
ISBN: 9781119256830
Author: Amos Gilat
Publisher: John Wiley & Sons Inc
expand_more
expand_more
format_list_bulleted
Related questions
Question
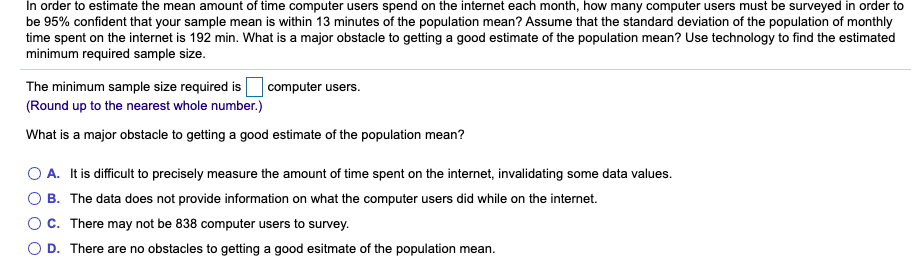

Transcribed Image Text:In order to estimate the mean amount of time computer users spend on the internet each month, how many computer users must be surveyed in order to
be 95% confident that your sample mean is within 13 minutes of the population mean? Assume that the standard deviation of the population of monthly
time spent on the internet is 192 min. What is a major obstacle to getting a good estimate of the population mean? Use technology to find the estimated
minimum required sample size.
The minimum sample size required is
(Round up to the nearest whole number.)
computer users.
What is a major obstacle to getting a good estimate of the population mean?
O A. It is difficult to precisely measure the amount of time spent on the internet, invalidating some data values.
B. The data does not provide information on what the computer users did while on the internet.
O C. There may not be 838 computer users to survey.
D. There are no obstacles to getting a good esitmate of the population mean.
Expert Solution
This question has been solved!
Explore an expertly crafted, step-by-step solution for a thorough understanding of key concepts.

This is a popular solution

Trending nowThis is a popular solution!

Step by stepSolved in 2 steps with 1 images

Knowledge Booster

Similar questions
- The Gidget Company makes widgets. If the production process is working properly, it turns out that the widgets are normally distributed with a hean length of at least 2.6 feet. Larger widgets can be used or altered but shorter widgets must be scrapped. You select a sample of 25 widgets, and the mean length is 2.46 feet and the sample standard deviation is 0.16 foot. Do you need to adjust the production equipment? Complete parts (a) through (d). Click here to view page 1 of the critical values for the t Distribution. Click here to view page 2 of the critical values for the t Distribution. a. If you test the null hypothesis at the 0.05 level of significance, what decision do you make using the critical value approach to hypothesis testing? What are the null and alternative hypotheses for this test? 'Α. H μ22.6 H4: µ 2.6 O C. Ho:H22.46 H,:H2.6 H,: µs2.6 O E. Ho: us2.46 H,:µ>2.46 OF. Ho:H<2.6 H1:µ22.6 What is the test statistic for this test? - 4.3750 (Round to four decimal places as…arrow_forwardConstruct 95% confidence for the population point estimate (sample proportion) which is given as P=0.4 N = 40 Be sure to check for normality of the sampling distribution.arrow_forwardAssume that the population has a normal distribution.Thirty randomly selected students took the statistics final. If the sample mean was 93 and the standard deviation was 6.6, construct a 99% confidence interval for the mean score of all students. Interpret the results.arrow_forward
- is computed from a sample and is used to estimate a population parameter.arrow_forwardWhat sample size is needed to give a margin of error within +4% in estimating a population proportion with 90% confidence? Use z-values rounded to three decimal places. Round your answer up to the nearest integer. Sample size = i 0.17 eTextbook and Media Hint Assistaarrow_forwardWhat sample size is needed to give a margin of error within+3% in estimating a population proportion with 90% confidence? We estimate that the population proportion is about 0.25. Round your answer up to the nearest integer. Sample size = iarrow_forward
- Use technology to help you test the claim about the population mean, p, at the given level of significance, a, using the given sample statistics. Assume the population is normally distributed. Claim: u > 1280; a = 0.07; o = 196.31. Sample statistics: x= 1308.11, n= 200 H p> 1280 Ha: p 1308.11 O D. Ho: Hs 1308.11 Ha ps 1308.11 Ha: p> 1308.11 O E. H, p> 1280 O F. Ho: µ2 1280 Ha: u< 1280 Ha ps 1280 Calculate the standardized test statistic. The standardized test statistic is 2.03. (Round to two decimal places as needed.) Determine the P-value. P 3D (Round to three decimal places as needed.)arrow_forwardestimate the population proportion p,what is the minimum sample size we need in order to achieve a margin of error no more than 0.01 with a 95% cinfidence level? Similar study in the past suggest an guess of 0.1 for the value of p.arrow_forwardWhat sample size is needed to give a margin of error within ±1.5% in estimating a population proportion with 99% confidence?Round your answer up to the nearest integer.Sample size =arrow_forward
- show work pleasearrow_forwardAnswer the last questionarrow_forwardYou want to obtain a sample to estimate a population proportion. At this point in time, you have no reasonable preliminary estimation for the population proportion. You would like to be 90% confident that you estimate is within 3.5% of the true population proportion. How large of a sample size is required?arrow_forward
arrow_back_ios
SEE MORE QUESTIONS
arrow_forward_ios
Recommended textbooks for you
- MATLAB: An Introduction with ApplicationsStatisticsISBN:9781119256830Author:Amos GilatPublisher:John Wiley & Sons Inc
 Probability and Statistics for Engineering and th...StatisticsISBN:9781305251809Author:Jay L. DevorePublisher:Cengage Learning
 Statistics for The Behavioral Sciences (MindTap C...StatisticsISBN:9781305504912Author:Frederick J Gravetter, Larry B. WallnauPublisher:Cengage Learning
  Elementary Statistics: Picturing the World (7th E...StatisticsISBN:9780134683416Author:Ron Larson, Betsy FarberPublisher:PEARSON
 The Basic Practice of StatisticsStatisticsISBN:9781319042578Author:David S. Moore, William I. Notz, Michael A. FlignerPublisher:W. H. Freeman
 Introduction to the Practice of StatisticsStatisticsISBN:9781319013387Author:David S. Moore, George P. McCabe, Bruce A. CraigPublisher:W. H. Freeman
MATLAB: An Introduction with Applications
Statistics
ISBN:9781119256830
Author:Amos Gilat
Publisher:John Wiley & Sons Inc
Probability and Statistics for Engineering and th...
Statistics
ISBN:9781305251809
Author:Jay L. Devore
Publisher:Cengage Learning
Statistics for The Behavioral Sciences (MindTap C...
Statistics
ISBN:9781305504912
Author:Frederick J Gravetter, Larry B. Wallnau
Publisher:Cengage Learning
Elementary Statistics: Picturing the World (7th E...
Statistics
ISBN:9780134683416
Author:Ron Larson, Betsy Farber
Publisher:PEARSON
The Basic Practice of Statistics
Statistics
ISBN:9781319042578
Author:David S. Moore, William I. Notz, Michael A. Fligner
Publisher:W. H. Freeman
Introduction to the Practice of Statistics
Statistics
ISBN:9781319013387
Author:David S. Moore, George P. McCabe, Bruce A. Craig
Publisher:W. H. Freeman