ENGR.ECONOMIC ANALYSIS
14th Edition
ISBN: 9780190931919
Author: NEWNAN
Publisher: Oxford University Press
expand_more
expand_more
format_list_bulleted
Question

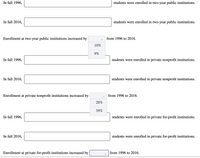
Transcribed Image Text:In fall 1996,
students were enrolled in two-year public institutions.
In fall 2016,
students were enrolled in two-year public institutions.
Enrollment at two-year public institutions increased by
from 1996 to 2016.
10%
9%
In fall 1996,
students were enrolled in private nonprofit institutions.
In fall 2016,
students were enrolled in private nonprofit institutions.
Enrollment at private nonprofit institutions increased by
from 1996 to 2016.
28%
39%
In fall 1996,
students were enrolled in private for-profit institutions.
In fall 2016,
students were enrolled in private for-profit institutions.
Enrollment at private for-profit institutions increased by
from 1996 to 2016.

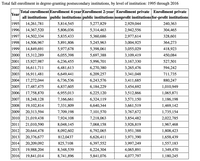
Transcribed Image Text:Total fall enrollment in degree-granting postsecondary institutions, by level of institution: 1995 through 2016
Total enrollment Enrollment 4-year Enrollment 2-year Enrollment private Enrollment private
Year
all institutions public institutions public institutions nonprofit institutions for-profit institutions
1995
14,261,781
5,814,545
5,277,829
2,929,044
240,363
1996
14,367,520
5,806,036
5,314,463
2,942,556
304,465
1997
14,502,334
5,835,433
5,360,686
2,977,614
328,601
1998
14,506,967
5,891,806
5,245,963
3,004,925
364,273
1999
14,849,691
5,977,678
5,398,061
3,055,029
418,923
2000
15,312,289
6,055,398
5,697,388
3,109,419
450,084
2001
15,927,987
6,236,455
5,996,701
3,167,330
527,501
2002
16,611,711
6,481,613
6,270,380
3,265,476
594,242
2003
16,911,481
6,649,441
6,209,257
3,341,048
711,735
2004
17,272,044
6,736,536
6,243,576
3,411,685
880,247
2005
17,487,475
6,837,605
6,184,229
3,454,692
1,010,949
2006
17,758,870
6,955,013
6,225,120
3,512,866
1,065,871
2007
18,248,128
7,166,661
6,324,119
3,571,150
1,186,198
2008
19,102,814
7,331,809
6,640,344
3,661,519
1,469,142
2009
20,313,594
7,709,198
7,101,570
3,767,672
1,735,154
2010
21,019,438
7,924,108
7,218,063
3,854,482
2,022,785
2011
21,010,590
8,048,145
7,068,158
3,926,819
1,967,468
2012
20,644,478
8,092,602
6,792,065
3,951,388
1,808,423
2013
20,376,677
812,0437
6,626,411
3,971,390
1,658,439
2014
20,209,092
825,7108
6,397,552
3,997,249
1,557,183
2015
19,988,204
8,348,539
6,224,304
4,065,891
1,349,470
2016
19,841,014
8,741,896
5,841,076
4,077,797
1,180,245
Expert Solution
This question has been solved!
Explore an expertly crafted, step-by-step solution for a thorough understanding of key concepts.
This is a popular solution
Trending nowThis is a popular solution!
Step by stepSolved in 2 steps with 3 images

Knowledge Booster
Learn more about
Need a deep-dive on the concept behind this application? Look no further. Learn more about this topic, economics and related others by exploring similar questions and additional content below.Similar questions
- 4) Mitsven Surfboard Inc. is a company in San Diego that shapes and sells surfboards. In 2018 their accounts were as follows: total revenues $150,000; cost of inputs $75,000; wages paid to employees $35,000; profits to owner $25,000, taxes paid by company $5,000. The building and the equipment used for production are property of the company, and no new building or new equipment was purchased in 2018. The value added produced by Mitsven Surfboard Inc. in 2018 was A. $150,000 B. $75,000 C. $65,000 D. $10,000 Answer: 5) Consider the accounts of Mitsven Surfboard Inc. described in question 4). Applying the income approach to GDP that we have studied in class, the depreciation (or consumption) of fixed capital for the company in 2018 was A. Zero. B. $10,000 C. $65,000. D. $75,000 Answer:arrow_forward(Q010) What the best way to characterize U.S. foreign aid? The United States spends a relatively small percentage of its gross national income on foreign aid but still invests more total dollars than other nations. The United States spends a relatively small percentage of its gross national income on foreign aid and therefore invests fewer total dollars than other nations. The United States spends a relatively high percentage of its gross national income on foreign aid and therefore invests more total dollars than other nations. The United States spends a relatively high percentage of its gross national income on foreign aid but still invests fewer total dollars than other nations.arrow_forwardquarter and years Quarter1 2015 Quarter2 Quarter3|Quarter4 Quarter1 Quarter2 Quarter3 Quarter4 Quarter1 Quarter2 Quarter3 Quarter4 2015 Unit 2015 2015 2016 2016 2016 2016 2017 2017 2017 Description $ million Data Category and Component 2017 27.748 27.938 31.873 30.435 26.157 25.806 29.337 27.748 27.938 31.873 30.435 Agriculture $ milion 32.141 29.598 28.073 31.514 33.489 33.727 32.686 32.141 29.598 28.073 31.514 Mining and Quarrying Manufacturing $ milion 70.892 74.946 76.020 77.940 73.899 77.680 79.324 70.892 74.946 76.020 77.940 $ milion 7.522 7.977 8.095 8.116 7.903 8.318 8.621 8.641 8.315 8.738 9.115 9.208 Blectricity, Gas and Water $ million 16.659 16.041 17.179 16.673 17.655 16.971 18.166 16.659 16.041 17.179 16.673 Construction Wholesale and Retal Trade, Accommodation and Restaurants $ mion 51.264 51.984 56.305 60.687 55.180 56.232 60.976 65.920 60.720 62.578 67.437 72.322 Transport, Storage and Communication $ milion 25.163 25.772 26.539 26.887 27.287 28.059 28.593 29.026…arrow_forward
- Performance of Key Sectors Exports of manufactured goods surpassed RM1 tril mark for the first time Manufactured Goods Manufactured Goods RM848.84 bil RM1.067 tril 个25.6% 123.4% 86.1%* 86.0% EXPORTS IMPORTS RM1.240 tril RM987.24 bil 5.6% 7.9% 5.4% 6.2% Others . Agriculture Goods RM4.71 bil RM98.10 Others Ágriculture Goods RM60.97 bil 个12.3% 136.8% RM24.40 bil Mining Goods RM69.79 bil 158.7% 125.0% 119.5% Mining Goods RM53.04 bil Note: * share 19.0% 1. ANALYSE THE PERFORMANCE OF THE KEYS SECTORS ABOVEarrow_forwardPlease give me correct answer Note:- Please avoid using ChatGPT and refrain from providing handwritten solutions; otherwise, I will definitely give a downvote. Also, be mindful of plagiarism. Answer completely and accurate answer. Rest assured, you will receive an upvote if the answer is accurate.arrow_forwardBureau of Economic Analysis in the USA is responsible for construction and maintenance of national income and product accounts (NIPA). Measurement began in the 1930s due to frustration of Roosevelt and Hoover trying to design policies to combat the Great Depression. Simon Kuznets (Nobel laureate) was commissioned to develop initial methodology and estimates. In 1947, the process became much more consistent. Methodologies have frequently been changed (improved?) as a result of advances in economics, accounting, and data collection. Past data are then revised to reflect new definitions. On the following information, calculate GNP at factor cost. Whether GNPFC derive from income method equivalent to expenditure method? S.No. Items Rs. (In Crores) 1 Private final consumption expenditure 1000 2 Net domestic capital formation (Investment) 200 3 Profit 400 4 Compensation of employers (Wages and salaries) 800 5 Rent 250 6 Government final consumption expenditure…arrow_forward
- Table 1: Financial Data McDonald's ($Millions) 27,441 15,446 2,488 31,534 Revenues Cost of Goods Sold (Materials) Wages and Salaries Capital Employed Interest Rate (Opportunity Cost of Capital)-5.0% Wendy's ($Millions) 2,061 1,400 274 3,806 Based on the data in Table 1 and using the methods related to Kay's concept of added value, what is the added value (in millions) for McDonald's? $9,507 ($22,027) $10,418 $23,376 $7.930arrow_forwardQuestion 2 (Business and Technology Strategy) 2.1 As a manager of the company, one of your subordinates approaches you with a strategy for the new project your company is engaged in. Develop a set of issues you would ensure that his or her strategy addresses. (8) 2.2 4.1 Show your understanding of a business management process by designing your own generic model for the strategic management process. (6) Subtotal marks = 14arrow_forwardDefinitions: "Cost" is the actual expense of nurse wages, IV bags, meals, medications, lab tests and payment for the room and bed. "Charges" is the amount the hospital puts on its bill. Almost no one pays that. "Revenue" is the actual cash collected for the service. It is generally comprised of insurance payments and patient copayments. Part 1: Hospital Case Study: The number of patients at Harbordale Hospital increased from 120 to 144 from Monday to Tuesday. The hospital’s costs increased $720,000 to $722,000 as temporary nurses were called in to deal with the heavy patient load. Question: Explain in detail the changes Harbordale Hospital is experiencing.arrow_forward
arrow_back_ios
arrow_forward_ios
Recommended textbooks for you

 Principles of Economics (12th Edition)EconomicsISBN:9780134078779Author:Karl E. Case, Ray C. Fair, Sharon E. OsterPublisher:PEARSON
 Engineering Economy (17th Edition)EconomicsISBN:9780134870069Author:William G. Sullivan, Elin M. Wicks, C. Patrick KoellingPublisher:PEARSON
 Principles of Economics (MindTap Course List)EconomicsISBN:9781305585126Author:N. Gregory MankiwPublisher:Cengage Learning
 Managerial Economics: A Problem Solving ApproachEconomicsISBN:9781337106665Author:Luke M. Froeb, Brian T. McCann, Michael R. Ward, Mike ShorPublisher:Cengage Learning
 Managerial Economics & Business Strategy (Mcgraw-...EconomicsISBN:9781259290619Author:Michael Baye, Jeff PrincePublisher:McGraw-Hill Education


Principles of Economics (12th Edition)
Economics
ISBN:9780134078779
Author:Karl E. Case, Ray C. Fair, Sharon E. Oster
Publisher:PEARSON

Engineering Economy (17th Edition)
Economics
ISBN:9780134870069
Author:William G. Sullivan, Elin M. Wicks, C. Patrick Koelling
Publisher:PEARSON

Principles of Economics (MindTap Course List)
Economics
ISBN:9781305585126
Author:N. Gregory Mankiw
Publisher:Cengage Learning

Managerial Economics: A Problem Solving Approach
Economics
ISBN:9781337106665
Author:Luke M. Froeb, Brian T. McCann, Michael R. Ward, Mike Shor
Publisher:Cengage Learning

Managerial Economics & Business Strategy (Mcgraw-...
Economics
ISBN:9781259290619
Author:Michael Baye, Jeff Prince
Publisher:McGraw-Hill Education