
MATLAB: An Introduction with Applications
6th Edition
ISBN: 9781119256830
Author: Amos Gilat
Publisher: John Wiley & Sons Inc
expand_more
expand_more
format_list_bulleted
Related questions
Question
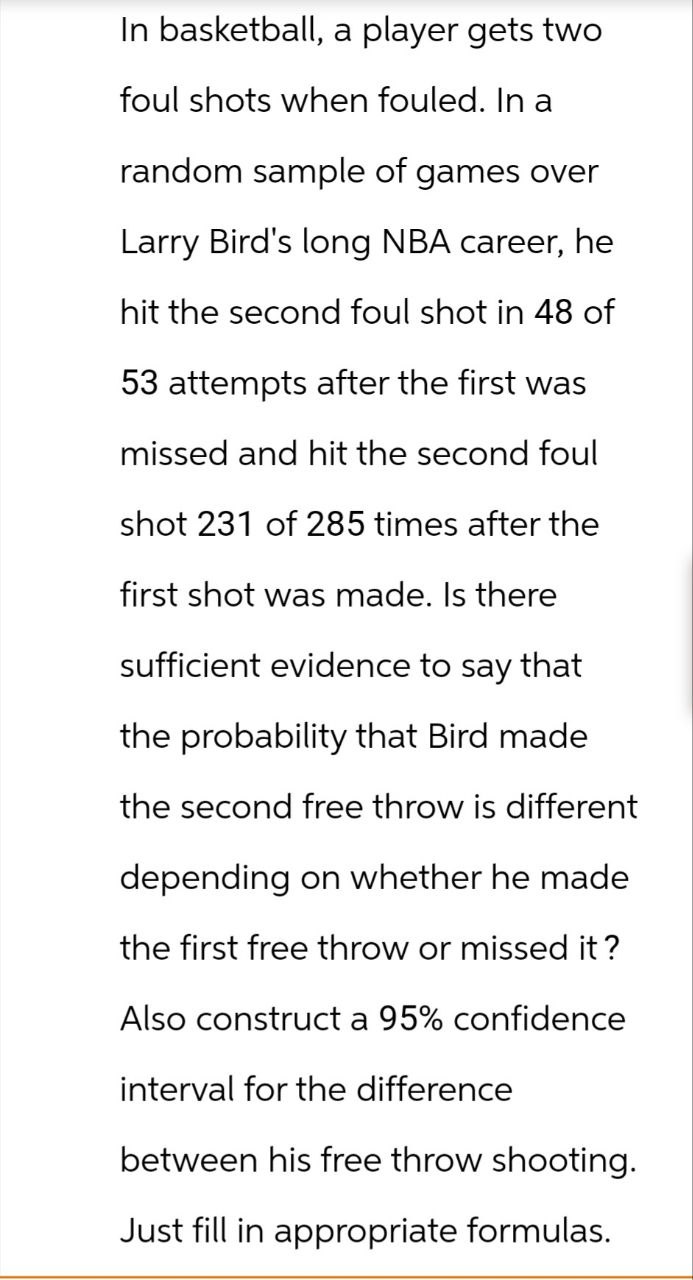

Transcribed Image Text:In basketball, a player gets two
foul shots when fouled. In a
random sample of games over
Larry Bird's long NBA career, he
hit the second foul shot in 48 of
53 attempts after the first was
missed and hit the second foul
shot 231 of 285 times after the
first shot was made. Is there
sufficient evidence to say that
the probability that Bird made
the second free throw is different
depending on whether he made
the first free throw or missed it?
Also construct a 95% confidence
interval for the difference
between his free throw shooting.
Just fill in appropriate formulas.
Expert Solution
This question has been solved!
Explore an expertly crafted, step-by-step solution for a thorough understanding of key concepts.

Step by stepSolved in 2 steps

Knowledge Booster

Similar questions
- The president of Doerman Distributors, Inc. believes that 30% of the firm's orders come from first-time customers. A random sample of 100 orders will be used to estimate the proportion of first-time customers. What is the probability that the sample proportion will be within .05?arrow_forwardA study showed that in 1990, 47% of all those involved in a fatal car crash wore seat belts. Of those in a fatal crash who wore seat belts, 46% were injured and 26% were killed. For those not wearing seat belts, the comparable figures were 43% and 51%, respectively. Find the probability that a randomly selected person who was unharmed in a fatal crash was not wearing a seat belt.arrow_forwardIt has been reported that 5% of all cars on the highway are traveling at speeds in excess of 70mph. If the speeds of four random auromobiles are measured via radar what is the probability that at least one car is going over 70 mpharrow_forward
- In 2014, 78.9% of US households spoke only English at home. What is the probability that atleast 12 of 15 randomly sampled US households speak only English at homearrow_forwardDo cat owners sleep better than those without cats? To help answer this question, a cat enthusiast obtained a random sample of 500 Canadians, each of whom answered two questions: 1. do you have a cat? (yes or no), 2. How well do you sleep? (good, neutral, bad). The dataset “CatSleep.xlsx” contains her findings. Find the probability that a randomly selected Canadian is a bad sleeper and a cat owner. Find the probability that a randomly selected Canadian is a neutral sleeper or a cat owner. Find the probability that a randomly selected non-cat owner is a bad sleeper. That is, find the probability that a randomly selected Canadian is a bad sleeper, given they are not a cat owner Can you handwrite the solution?arrow_forwardState the predicted probability of being a 53 year old menopausal woman whose hemoglobin level is 15?arrow_forward
- Based on observation 85% of the population of adult males wash their hands in a public restroom. In a survey of 523 adult males, 518 reported they washed their hands when using a public restroom. Find the probability that among 523 randomly selected adult males 518 or more wash their hands in a public. restroom. Does it appear that all the people who claimed they washed their hands were telling the truth?arrow_forwardA baseball team claims that the mean length of its games is more than 1.4 hours. State H0 and Ha in words and in symbols. Then determine whether the hypothesis test for this claim is left-tailed, right-tailed, or two-tailed. Explain your reasoning. State the null hypothesis in words and in symbols. Choose the correct answer below. A. The null hypothesis expressed in words is, "the mean length of a baseball team's games is not 1.4 hours." The null hypothesis is expressed symbolically as, "H0: μ≠1.4." B. The null hypothesis expressed in words is, "the mean length of a baseball team's games is at least 1.4 hours." The null hypothesis is expressed symbolically as, "H0: μ≥1.4." C. The null hypothesis expressed in words is, "the mean length of a baseball team's games is at most 1.4 hours." The null hypothesis is expressed symbolically as, "H0: μ≤1.4." D. The null hypothesis expressed in words is, "the mean length of a…arrow_forward
arrow_back_ios
arrow_forward_ios
Recommended textbooks for you
- MATLAB: An Introduction with ApplicationsStatisticsISBN:9781119256830Author:Amos GilatPublisher:John Wiley & Sons Inc
 Probability and Statistics for Engineering and th...StatisticsISBN:9781305251809Author:Jay L. DevorePublisher:Cengage Learning
 Statistics for The Behavioral Sciences (MindTap C...StatisticsISBN:9781305504912Author:Frederick J Gravetter, Larry B. WallnauPublisher:Cengage Learning
  Elementary Statistics: Picturing the World (7th E...StatisticsISBN:9780134683416Author:Ron Larson, Betsy FarberPublisher:PEARSON
 The Basic Practice of StatisticsStatisticsISBN:9781319042578Author:David S. Moore, William I. Notz, Michael A. FlignerPublisher:W. H. Freeman
 Introduction to the Practice of StatisticsStatisticsISBN:9781319013387Author:David S. Moore, George P. McCabe, Bruce A. CraigPublisher:W. H. Freeman
MATLAB: An Introduction with Applications
Statistics
ISBN:9781119256830
Author:Amos Gilat
Publisher:John Wiley & Sons Inc
Probability and Statistics for Engineering and th...
Statistics
ISBN:9781305251809
Author:Jay L. Devore
Publisher:Cengage Learning
Statistics for The Behavioral Sciences (MindTap C...
Statistics
ISBN:9781305504912
Author:Frederick J Gravetter, Larry B. Wallnau
Publisher:Cengage Learning
Elementary Statistics: Picturing the World (7th E...
Statistics
ISBN:9780134683416
Author:Ron Larson, Betsy Farber
Publisher:PEARSON
The Basic Practice of Statistics
Statistics
ISBN:9781319042578
Author:David S. Moore, William I. Notz, Michael A. Fligner
Publisher:W. H. Freeman
Introduction to the Practice of Statistics
Statistics
ISBN:9781319013387
Author:David S. Moore, George P. McCabe, Bruce A. Craig
Publisher:W. H. Freeman