
MATLAB: An Introduction with Applications
6th Edition
ISBN: 9781119256830
Author: Amos Gilat
Publisher: John Wiley & Sons Inc
expand_more
expand_more
format_list_bulleted
Related questions
Question
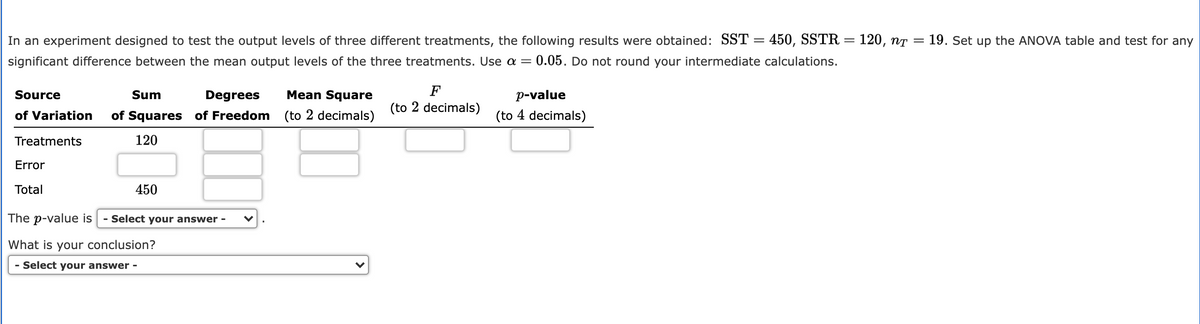

Transcribed Image Text:In an experiment designed to test the output levels of three different treatments, the following results were obtained: SST = 450, SSTR :
120, nT
19. Set up the ANOVA table and test for any
significant difference between the mean output levels of the three treatments. Use a = 0.05. Do not round your intermediate calculations.
Source
Sum
Degrees
Mean Square
F
p-value
(to 2 decimals)
of Variation
of Squares of Freedom
(to 2 decimals)
(to 4 decimals)
Treatments
120
Error
Total
450
The p-value is
- Select your answer -
What is your conclusion?
- Select your answer -
Expert Solution
This question has been solved!
Explore an expertly crafted, step-by-step solution for a thorough understanding of key concepts.

This is a popular solution

Trending nowThis is a popular solution!

Step by stepSolved in 2 steps with 2 images

Knowledge Booster

Similar questions
- comparison of the precisions of two machines developed for extracting juice from oranges is to be made using the following data. Is there sufficient evidence to indicate that there is a difference in the precision of the two machines at the 5% level of significance? Machine A Machine B s2 = 1.4 ounces2 s2 = 3.1 ounces2 n=25 n=20arrow_forwardConsider the ANOVA table shown here for a one-way analysis of variance for an experimental design in which there are four treatment levels: Source Between Error Total Df 29 SS 485.50 715.50 The observed F value is ____. MS Farrow_forwardFor the Kruskal-Wallis ANOVA: Is there a statistical difference between the rankings of the core temperatures of the groups exposed to either a cold, neutral, or hot environment? (smaller number= coldest core temperature ranking, largest number= hottest core temperature ranking).” Ranks that are tied, get an average value of the two ranks. The Data is attached. Thank you.arrow_forward
- Use the following ANOVA table for regression to answer the questions. Analysis of Variance Source DF SS MS F P Regression 1 291.4 291.4 2.01 0.158 Residual Error 174 25230.0 145.0 Total 175 25521.4 Give the F-statistic and p-value.Enter the exact answers.The F-statistic is =The p-value is =arrow_forwardAn ANOVA is used to evaluate the mean difference among three treatment conditions with a sample of n= 12 particpantsin each treatment. For study, what is df total?arrow_forwardA study was conducted to determine if the performance of a certain type of surgery on young horses had any effect on certain kinds of blood cell types in the animal. Fluid samples were taken from each of six foals an hour after the operation. Suppose that the data on WBC leukocytes follow the normal distribution. One sample Chi-squared test for variancedata: wbcX-squared = 3.5321, df = 5, p-value = 0.3815alternaative hypothesis: true variance is less than 4 Question: Is there evidence to say that the variance of WBC leukocytes is less than 4? State the conclusion based from the results of the test. Choices:- There is no sufficient evidence that the variance of WBC leukocytes is less than 4.- There is a sufficient evidence that the variance of WBC leukocytes is less than 4.arrow_forward
- Suppose the mean retail price oer gallon of regular gasoline int the United States is $3.42 with a standard eviation of $0.40 and the retail price per gallon has a normal bell shaped distribution. Use the Empirical Rule to answer the following quesitona. What percentage of regular gasoline sold between $2.62 and $3.82 per gallon? what percentage of regualr gasoline sold for more the $3.82 per gallon?arrow_forwardwhat is the value in cell D? Round to 2 decimal places. How many total observations were there in the study? Hint: use df(total) to figure out the number of total observations. The following computer output is for an analysis of variance in which yields (bu/acre) of different varieties of oats were compared. Answer the following questions based on this ANOVA table. Source df SS MS F ratio Prob Between groups 2 76.90 38.45 D 0.63 Within groups 11 859.81 78.16 Total 13 936.17arrow_forwardSuppose x has a distribution with ? = 14 and ? = 7. (a) If a random sample of size n = 33 is drawn, find ?x, ? x and P(14 ≤ x ≤ 16). (Round ?x to two decimal places and the probability to four decimal places.) ?x = ? x = P(14 ≤ x ≤ 16) = (b) If a random sample of size n = 65 is drawn, find ?x, ? x and P(14 ≤ x ≤ 16). (Round ? x to two decimal places and the probability to four decimal places.) ?x = ? x = P(14 ≤ x ≤ 16) = (c) Why should you expect the probability of part (b) to be higher than that of part (a)? (Hint: Consider the standard deviations in parts (a) and (b).)The standard deviation of part (b) is part (a) because of the sample size. Therefore, the distribution about ?x is .arrow_forward
- A repeated-measures ANOVA was calculated with df = 1, 14. If the same data were analyzed with a repeated-measures t test, how many degrees of freedom would be used with the t statistic?arrow_forwardHow does increasing the alpha/significance level increase the power of a statistical test?arrow_forward
arrow_back_ios
arrow_forward_ios
Recommended textbooks for you
- MATLAB: An Introduction with ApplicationsStatisticsISBN:9781119256830Author:Amos GilatPublisher:John Wiley & Sons Inc
 Probability and Statistics for Engineering and th...StatisticsISBN:9781305251809Author:Jay L. DevorePublisher:Cengage Learning
 Statistics for The Behavioral Sciences (MindTap C...StatisticsISBN:9781305504912Author:Frederick J Gravetter, Larry B. WallnauPublisher:Cengage Learning
  Elementary Statistics: Picturing the World (7th E...StatisticsISBN:9780134683416Author:Ron Larson, Betsy FarberPublisher:PEARSON
 The Basic Practice of StatisticsStatisticsISBN:9781319042578Author:David S. Moore, William I. Notz, Michael A. FlignerPublisher:W. H. Freeman
 Introduction to the Practice of StatisticsStatisticsISBN:9781319013387Author:David S. Moore, George P. McCabe, Bruce A. CraigPublisher:W. H. Freeman
MATLAB: An Introduction with Applications
Statistics
ISBN:9781119256830
Author:Amos Gilat
Publisher:John Wiley & Sons Inc
Probability and Statistics for Engineering and th...
Statistics
ISBN:9781305251809
Author:Jay L. Devore
Publisher:Cengage Learning
Statistics for The Behavioral Sciences (MindTap C...
Statistics
ISBN:9781305504912
Author:Frederick J Gravetter, Larry B. Wallnau
Publisher:Cengage Learning
Elementary Statistics: Picturing the World (7th E...
Statistics
ISBN:9780134683416
Author:Ron Larson, Betsy Farber
Publisher:PEARSON
The Basic Practice of Statistics
Statistics
ISBN:9781319042578
Author:David S. Moore, William I. Notz, Michael A. Fligner
Publisher:W. H. Freeman
Introduction to the Practice of Statistics
Statistics
ISBN:9781319013387
Author:David S. Moore, George P. McCabe, Bruce A. Craig
Publisher:W. H. Freeman