
MATLAB: An Introduction with Applications
6th Edition
ISBN: 9781119256830
Author: Amos Gilat
Publisher: John Wiley & Sons Inc
expand_more
expand_more
format_list_bulleted
Related questions
Question
Plz solve it correctly I vill give 4 upvotes.
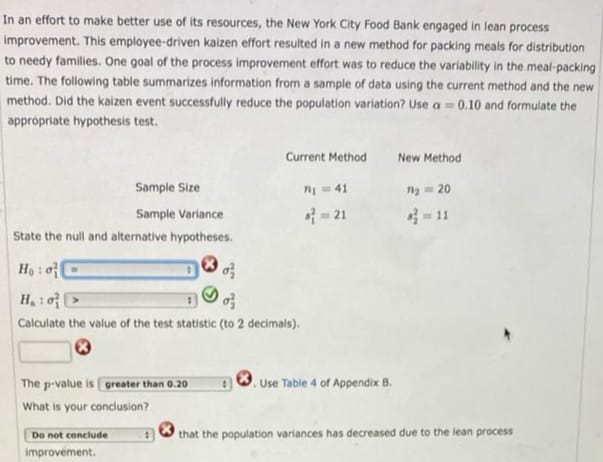

Transcribed Image Text:In an effort to make better use of its resources, the New York City Food Bank engaged in lean process
improvement. This employee-driven kaizen effort resulted in a new method for packing meals for distribution
to needy families. One goal of the process improvement effort was to reduce the variability in the meal-packing
time. The following table summarizes information from a sample of data using the current method and the new
method. Did the kaizen event successfully reduce the population variation? Use a 0.10 and formulate the
appropriate hypothesis test.
Sample Size
Sample Variance
State the null and alternative hypotheses.
The p-value is greater than 0.20
What is your conclusion?
Current Method
Ho: o
of
H₁: o
of
Calculate the value of the test statistic (to 2 decimals).
Do not conclude
improvement.
7₁ = 41
4=21
Use Table 4 of Appendix B.
New Method
m₂ = 20
that the population variances has decreased due to the lean process
Expert Solution
This question has been solved!
Explore an expertly crafted, step-by-step solution for a thorough understanding of key concepts.

Step by stepSolved in 3 steps with 11 images

Knowledge Booster

Similar questions
- pls help ASAP.arrow_forwardMr. Jones has a penny jar. He places pennies in his jar every day at the samerate. Pretend there are 58 pennies in the jar on day 14.a) Sam thinks 30 + 2D= T (where D is the number of days and T is the totalin the jar) might be Mr. Jones’s penny jar. Would Sam’s formula fit Mr.Jones’ penny jar? (explain)arrow_forward-5V12x +17 b. 621x - 14 + 8 = 5 a. 2. Show how to solve the equation. Remember to check for extraneous solutions x - 5 = V10 - 2xarrow_forward
arrow_back_ios
arrow_forward_ios
Recommended textbooks for you
- MATLAB: An Introduction with ApplicationsStatisticsISBN:9781119256830Author:Amos GilatPublisher:John Wiley & Sons Inc
 Probability and Statistics for Engineering and th...StatisticsISBN:9781305251809Author:Jay L. DevorePublisher:Cengage Learning
 Statistics for The Behavioral Sciences (MindTap C...StatisticsISBN:9781305504912Author:Frederick J Gravetter, Larry B. WallnauPublisher:Cengage Learning
  Elementary Statistics: Picturing the World (7th E...StatisticsISBN:9780134683416Author:Ron Larson, Betsy FarberPublisher:PEARSON
 The Basic Practice of StatisticsStatisticsISBN:9781319042578Author:David S. Moore, William I. Notz, Michael A. FlignerPublisher:W. H. Freeman
 Introduction to the Practice of StatisticsStatisticsISBN:9781319013387Author:David S. Moore, George P. McCabe, Bruce A. CraigPublisher:W. H. Freeman
MATLAB: An Introduction with Applications
Statistics
ISBN:9781119256830
Author:Amos Gilat
Publisher:John Wiley & Sons Inc
Probability and Statistics for Engineering and th...
Statistics
ISBN:9781305251809
Author:Jay L. Devore
Publisher:Cengage Learning
Statistics for The Behavioral Sciences (MindTap C...
Statistics
ISBN:9781305504912
Author:Frederick J Gravetter, Larry B. Wallnau
Publisher:Cengage Learning
Elementary Statistics: Picturing the World (7th E...
Statistics
ISBN:9780134683416
Author:Ron Larson, Betsy Farber
Publisher:PEARSON
The Basic Practice of Statistics
Statistics
ISBN:9781319042578
Author:David S. Moore, William I. Notz, Michael A. Fligner
Publisher:W. H. Freeman
Introduction to the Practice of Statistics
Statistics
ISBN:9781319013387
Author:David S. Moore, George P. McCabe, Bruce A. Craig
Publisher:W. H. Freeman