
MATLAB: An Introduction with Applications
6th Edition
ISBN: 9781119256830
Author: Amos Gilat
Publisher: John Wiley & Sons Inc
expand_more
expand_more
format_list_bulleted
Related questions
Question
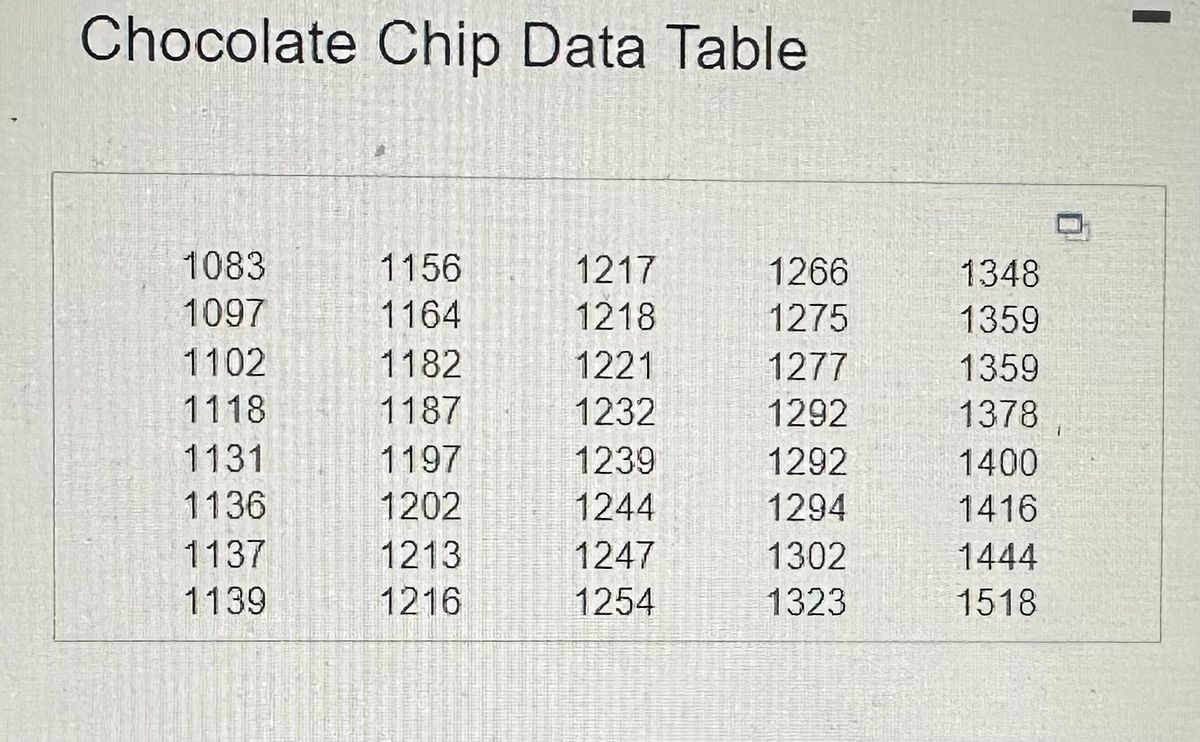

Transcribed Image Text:Chocolate Chip Data Table
1083
1097
1102
1118
1131
1136
1137
1139
1156
1164
1182
1187
1197
1202
1213
1216
1217
1218
1221
1232
1239
1244
1247
1254
1266
1275
1277
1292
1292
1294
1302
1323
1348
1359
1359
1378
1400
1416
1444
1518
1
I

Transcribed Image Text:In an advertising campaign, a snack company claimed that every 18-ounce bag of its cookies contained at least 1000 chocolate chips. Two statisticians attempted to verify the claim. The accompanying
data represent the number of chips in an 18-ounce bag of the company's cookies based on their study. Complete parts (a) through (e).
Click here to view the chocolate chip data table
Click here to view the standard normal distribution table (page 1).
Click here to view the standard normal distribution table (page 2).
(a) Draw a normal probability plot to determine if the data could have come from a normal distribution.
Choose the correct plot below.
O A.
Expected z-score
2.5-
0-
-2.5-
poppe
1000 1300 1600
Observed value
Q
2
-
OB.
Expected z-score
2.5-
0-
co
-2.5
1000
mocn
1300 1600
Observed value
Q
G
Expected z-score
C.
2.5-
0-
-2.5-
1000
27
1300 1600
Observed value
Q
oo
Q
OD.
Expected z-score
2.5
0-
-254
1000 1300 1600
Observed value
Q
N
Expert Solution
This question has been solved!
Explore an expertly crafted, step-by-step solution for a thorough understanding of key concepts.

Step by stepSolved in 3 steps with 2 images

Knowledge Booster

Similar questions
- According to the Carnegie unit system, the recommended number of hours students should study per unit is 2. Are statistics students' study hours less than the recommended number of hours per unit? The data show the results of a survey of 13 statistics students who were asked how many hours per unit they studied. Assume a normal distribution for the population. 0.7, 1.8, 1, 0.6, 3, 0.9, 0.9, 1, 3.2, 1.5, 0.1, 0.1, 3.2 What can be concluded at the αα = 0.10 level of significance? The test statistic = ___________ (please show your answer to 3 decimal places.) The p-value = ____________ (Please show your answer to 4 decimal places.)arrow_forwardPatients with two kinds of diagnoses were randomly assigned to one of three types of therapy and the effectiveness of the therapy was measure a 1-to-15 scale (with a higher number indicating greater effectiveness). There were two patients per cell. Use the data available below to comple parts (a) through (d) below. Click the icon to view the data table. Click here to view page 1 of the table of cutoff values for the F distribution. Click here to view page 2 of the table of cutoff values for the F distribution. Click here to view page 3 of the table of cutoff values for the F distribution. Click here to view page 4 of the table of cutoff values for the F distribution (a) Carry out the analysis of variance (use the 0.05 significance level). Complete the analysis of variance table for the data set below. SS MS F Source Columns Rows Interaction Within Total (Round to two decimal places as needed.) Data Table Diagnosis I Diagnosis II Therapy A 5 1 7 Print Therapy B 7 12 Done Therapy C 4282…arrow_forwardAccording to the Carnegie unit system, the recommended number of hours students should study per unit is 2. Are statistics students' study hours more than the recommended number of hours per unit? The data show the results of a survey of 11 statistics students who were asked how many hours per unit they studied. Assume a normal distribution for the population. 2, 2.9, 4.5, 0.7, 3.3, 4.5, 4.2, 1.2, 0.9, 1.8, 2.8 What can be concluded at the αα = 0.05 level of significance? The p-value = (Please show your answer to 4 decimal places. Based on this, we should Select an answer fail to reject accept reject the null hypothesis Thus, the final conclusion is that ... The data suggest the populaton mean is significantly more than 2 at αα = 0.05, so there is enough evidence to conclude that the population mean study time per unit for statistics students is more than 2. The data suggest the population mean is not significantly more than 2 at αα = 0.05, so there is enough evidence to…arrow_forward
- Meredith Grey has asked every surgeon at Grey-Sloan Memorial Hospital the following question: "How many surgeries have you scrubbed in on in the past 30 days?" The results are shown below. Number of surgeries 30 40 50 50 90 55 70 70 85 55 70 85 85 55 65 80 60 85 70 80 75 85 135 90 80 85 95 50 75 75 Find the following measures of center. Mean = Median = Mode =arrow_forwardA manufacturer of exercise equipment wanted to collect data on the effectiveness of their equipment. A magazine article compared how long it would take men and women to burn 200 calories during light or heavy workouts on various kinds of exercise equipment. The results summarized in the accompanying table are the average times for a group of physically active young men and women whose performances were measured on a representative sample of exercise equipment. Assume normality of the population. Complete parts (a) through (c) below. Click the icon to view the data table. C a) On average, how many minutes longer than a man must a woman exercise at a light exertion rate in order to burn 200 calories? Find a 95% confidence interval. minutes (Round to one decimal place as needed.) b) Estimate the average number of minutes longer a woman must work out at a light exertion than at heavy exertion to get the same benefit. Find a 95% confidence interval. (₁) minutes (Round to one decimal place…arrow_forwardDescribe and explain the location of the mean, mode, and median for a normal curve.arrow_forward
- According to the Carnegie unit system, the recommended number of hours students should study per unit is 2. Are statistics students' study hours different from the recommended number of hours per unit? The data show the results of a survey of 16 statistics students who were asked how many hours per unit they studied. Assume a normal distribution for the population. 1.5, 2, 2.9, 3.8, 4.6, 1.1, 1.8, 2.6, 1.4, 2.8, 4.5, 1.2, 1, 0.7, 3, 1.2 What can be concluded at the αα = 0.05 level of significance? For this study, we should use Select an answer t-test for a population mean z-test for a population proportion The null and alternative hypotheses would be: H0:H0: ? μ p Select an answer < ≠ = > H1:H1: ? p μ Select an answer < ≠ = > The test statistic ? z t = (please show your answer to 3 decimal places.) The p-value = (Please show your answer to 4 decimal places.) The p-value is ? > ≤ αα Based on this, we should Select an answer reject fail to…arrow_forwardAccording to the Carnegie unit system, the recommended number of hours students should study per unit is 2. Are statistics students' study hours less than the recommended number of hours per unit? The data show the results of a survey of 13 statistics students who were asked how many hours per unit they studied. Assume a normal distribution for the population. 2.1, 3.4, 1.9, 3, 2.5, 2.6, 0.2, 3.4, 1.2, 1.7, 3, 1, 0.2 What can be concluded at the αα = 0.05 level of significance? For this study, we should use The null and alternative hypotheses would be: H0:H0: H1:H1: The test statistic = (please show your answer to 3 decimal places.) The p-value = (Please show your answer to 4 decimal places.)arrow_forwardAccording to the Carnegie unit system, the recommended number of hours students should study per unit is 2. Are statistics students' study hours more than the recommended number of hours per unit? The data show the results of a survey of 12 statistics students who were asked how many hours per unit they studied. Assume a normal distribution for the population. 1.2, 4.3, 4.5, 1.4, 1.5, 2.7, 1.8, 2.4, 1.3, 2, 2.2, 1.3 What can be concluded at the αα = 0.05 level of significance? A. Thus, the final conclusion is that ... The data suggest the populaton mean is significantly more than 2 at αα = 0.05, so there is enough evidence to conclude that the population mean study time per unit for statistics students is more than 2. The data suggest the population mean is not significantly more than 2 at αα = 0.05, so there is enough evidence to conclude that the population mean study time per unit for statistics students is equal to 2. The data suggest that the population mean study time per…arrow_forward
- According to the Carnegie unit system, the recommended number of hours students should study per unit is 2. Are statistics students' study hours less than the recommended number of hours per unit? The data show the results of a survey of 11 statistics students who were asked how many hours per unit they studied. Assume a normal distribution for the population. 3.2, 0, 0, 0, 3.2, 3.2, 1.1, 0.8, 0.5, 1.3, 3.5 What can be concluded at the a = 0.05 level of significance? a. For this study, we should use b. The null and alternative hypotheses would be: Select an answer Ho: Select an answer O H1: Select an answer O c. The test statistic ? 0 = (please show your answer to 3 decimal places.) d. The p-value = (Please show your answer to 4 decimal places.) e. The p-value is ? e a f. Based on this, we should Select an answer e the null hypothesis. g. Thus, the final conclusion is that ... The data suggest the populaton mean is significantly less than 2 at a = 0.05, so there is sufficient evidence…arrow_forwardAn immunologist wants to compare two rabies vaccines. People who had previously received the vaccine were divided into two groups. The first group received a booster dose of type I vaccine and the second group received a booster dose of type II vaccine. Two weeks later the antibody level was measured. The average number of antibodies in each group appears in the following table Do these data indicate that there is a difference in the effectiveness of the two vaccines used for booster doses? Assume a normal distribution and equal population variances. The test statistic that will determine if there is a difference in the effectiveness of the two vaccines..... A. 2,579 B. 2.76 C. 0.58 D. 0.787arrow_forwarda. (True or False) The weekly consumption of favorite beverages from this survey hasapproximately a normal distribution, explain your decision. b. Based on the histogram, which one is greater: mean or median? Explain why.c. Which summary statistic would be a better representation of the center for this sample:mean or median?arrow_forward
arrow_back_ios
SEE MORE QUESTIONS
arrow_forward_ios
Recommended textbooks for you
- MATLAB: An Introduction with ApplicationsStatisticsISBN:9781119256830Author:Amos GilatPublisher:John Wiley & Sons Inc
 Probability and Statistics for Engineering and th...StatisticsISBN:9781305251809Author:Jay L. DevorePublisher:Cengage Learning
 Statistics for The Behavioral Sciences (MindTap C...StatisticsISBN:9781305504912Author:Frederick J Gravetter, Larry B. WallnauPublisher:Cengage Learning
  Elementary Statistics: Picturing the World (7th E...StatisticsISBN:9780134683416Author:Ron Larson, Betsy FarberPublisher:PEARSON
 The Basic Practice of StatisticsStatisticsISBN:9781319042578Author:David S. Moore, William I. Notz, Michael A. FlignerPublisher:W. H. Freeman
 Introduction to the Practice of StatisticsStatisticsISBN:9781319013387Author:David S. Moore, George P. McCabe, Bruce A. CraigPublisher:W. H. Freeman
MATLAB: An Introduction with Applications
Statistics
ISBN:9781119256830
Author:Amos Gilat
Publisher:John Wiley & Sons Inc
Probability and Statistics for Engineering and th...
Statistics
ISBN:9781305251809
Author:Jay L. Devore
Publisher:Cengage Learning
Statistics for The Behavioral Sciences (MindTap C...
Statistics
ISBN:9781305504912
Author:Frederick J Gravetter, Larry B. Wallnau
Publisher:Cengage Learning
Elementary Statistics: Picturing the World (7th E...
Statistics
ISBN:9780134683416
Author:Ron Larson, Betsy Farber
Publisher:PEARSON
The Basic Practice of Statistics
Statistics
ISBN:9781319042578
Author:David S. Moore, William I. Notz, Michael A. Fligner
Publisher:W. H. Freeman
Introduction to the Practice of Statistics
Statistics
ISBN:9781319013387
Author:David S. Moore, George P. McCabe, Bruce A. Craig
Publisher:W. H. Freeman