
MATLAB: An Introduction with Applications
6th Edition
ISBN: 9781119256830
Author: Amos Gilat
Publisher: John Wiley & Sons Inc
expand_more
expand_more
format_list_bulleted
Related questions
Question
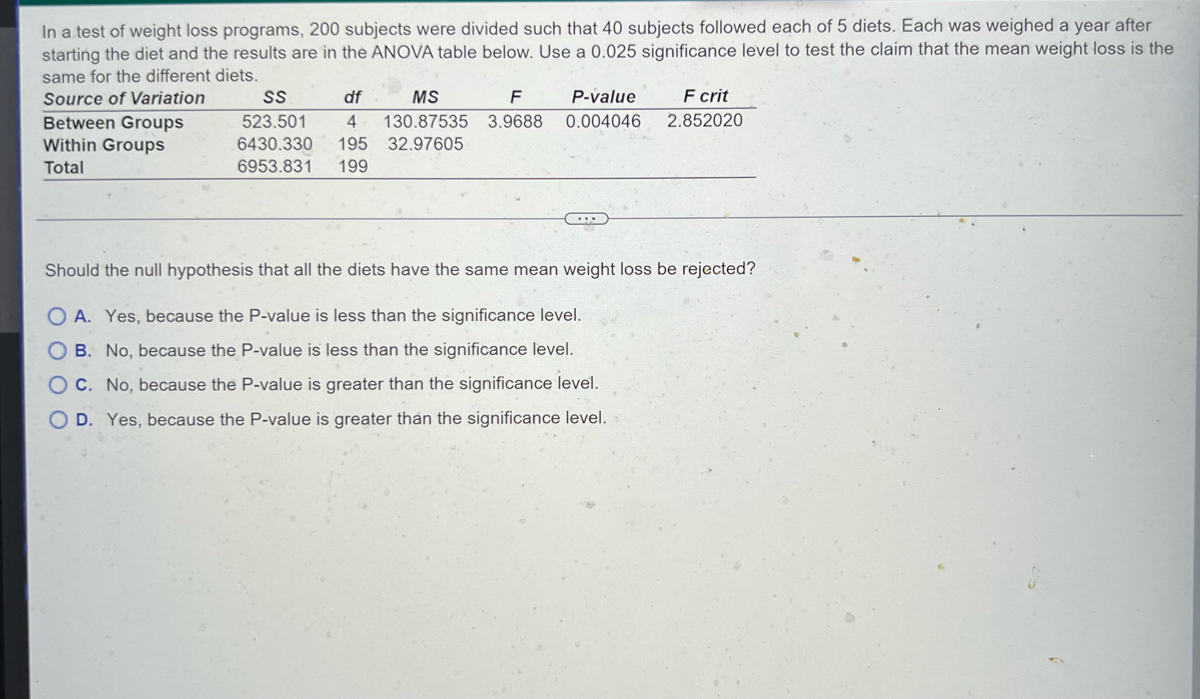

Transcribed Image Text:In a test of weight loss programs, 200 subjects were divided such that 40 subjects followed each of 5 diets. Each was weighed a year after
starting the diet and the results are in the ANOVA table below. Use a 0.025 significance level to test the claim that the mean weight loss is the
same for the different diets.
Source of Variation
df
MS
F
P-value
F crit
2.852020
Between Groups
SS
523.501
6430.330
6953.831
Within Groups
4 130.87535 3.9688 0.004046
195 32.97605
199
Total
Should the null hypothesis that all the diets have the same mean weight loss be rejected?
OA. Yes, because the P-value is less than the significance level.
OB. No, because the P-value is less than the significance level.
OC. No, because the P-value is greater than the significance level.
OD. Yes, because the P-value is greater than the significance level.
Expert Solution
This question has been solved!
Explore an expertly crafted, step-by-step solution for a thorough understanding of key concepts.

This is a popular solution

Trending nowThis is a popular solution!

Step by stepSolved in 2 steps

Knowledge Booster

Similar questions
- For the Kruskal-Wallis ANOVA: Is there a statistical difference between the rankings of the core temperatures of the groups exposed to either a cold, neutral, or hot environment? (smaller number= coldest core temperature ranking, largest number= hottest core temperature ranking).” Ranks that are tied, get an average value of the two ranks. The Data is attached. Thank you.arrow_forwardwe look at a random sample of 1000 united flights in the month of December comparing the actual arrival time to the scheduled arrive time. computer output of the descriptive statistics for the difference in actual and expected arrival time of these 1000 flights are shown below : N=1000 Mean =4.06 St Dev. = 45.4 SE Mean =1.44 Min= -35 Q1 = -14 Median = -5 Q3 =9 Max =871 what is the sample mean difference in actual and expected arrival times? what is the standard deviation of the difference ? x bar = and s= ?arrow_forwardA hypertensions trial is mounted and 12 participants are randomly assigned to receive either a new medication or a placebo. Each participant takes assigned medication and their systolic blood pressure (SBP) is recorded after 6 months on the assigned medication the data are shown in table 7-9 is there a difference in the mean SBP between treatment? Run the appropriate test at a =0.05arrow_forward
- Is there a treatment that appears to be most effective in the sandy and dry region?arrow_forwardIs narcissism a more common personality trait today than it was a few decades ago? It is known that the mean population score on the Narcissistic Personality Inventory (NPI) for students attending University of South Alabama around 20 years ago was μ= 15 (Twenge, 2010). Interested in the narcissism levels of students in the year 2020, a researcher administers the NPI to a random sample of 25 University of Alabama sophomores this Spring term. The mean NPI score from the researcher’s sample of sophomores is M = 16.5, with s = 3.4. 1. Write the null and alternative hypotheses in symbols. Possible symbols for your answer: H0, H1, μ, M, σ. 2. Calculate the standard error. 3. Find the critical value for the test statistic, assuming alpha = .05 (Use largest [i.e., most conservative] value if exact value not given in the chart) a) 2.064 b) 1.96 c) 1.98 d) 2.000arrow_forwardIn a test of weight loss programs, 111 subjects were divided such that 37 subjects followed each of 3 diets. Each was weighed a year after starting the diet and the results are in the ANOVA table below. Use a 0.05 significance level to test the claim that the mean weight loss is the same for the different diets. Source of Variation Between Groups Within Groups Total P-value 25.38918 0.8127 0.446353 F crit 3.080387 df MS F 50.778 3373.977 3424.755 2 108 31.24053 110 Should the null hypothesis that all the diets have the same mean weight loss be rejected? O A. Yes, because the P-value is greater than the significance level. O B. No, because the P-value is greater than the significance level. OC. No, because the P-value is less than the significance level. O D. Yes, because the P-value is less than the significance level.arrow_forward
- Given the following ANOVA table: Degrees Mean Source of of Variance Sum of Sum of F-stat Squares Freedom Squares | Regression 2 5.5 Residual 27 2.507 Total What is the value of SST? Please report your answer in 3 decimal places.arrow_forwardAn analysis is conducted to compare mean time to pain relief (measured in minutes) under four competing treatment regimens. Summary statistics on the four treatments are shown below. Complete the following ANOVA Table. Source of Variation SS df MS F Between Groups Within Groups 3719.48 Totalarrow_forwardThe recommended hours of sleep per night for adults is 8 hours. A doctor, who works at a sleep study facility, believes average number of hours of sleep per night for adults is more than the recommended 8 hours. To test this claim, at th significance level, the doctor collects the following data on a sample of 25 adults at the sleep study facility and records amount of sleep. The following is the data from this study: Sample size = 25 adults Sample mean = 8.5 hours Sample standard deviation = 0.9 hours Identify the null and alternative hypothesis for this study by filling in the blanks with the correct symbol (=#, t represent the correct hypothesis.) Provide your answer below:arrow_forward
arrow_back_ios
arrow_forward_ios
Recommended textbooks for you
- MATLAB: An Introduction with ApplicationsStatisticsISBN:9781119256830Author:Amos GilatPublisher:John Wiley & Sons Inc
 Probability and Statistics for Engineering and th...StatisticsISBN:9781305251809Author:Jay L. DevorePublisher:Cengage Learning
 Statistics for The Behavioral Sciences (MindTap C...StatisticsISBN:9781305504912Author:Frederick J Gravetter, Larry B. WallnauPublisher:Cengage Learning
  Elementary Statistics: Picturing the World (7th E...StatisticsISBN:9780134683416Author:Ron Larson, Betsy FarberPublisher:PEARSON
 The Basic Practice of StatisticsStatisticsISBN:9781319042578Author:David S. Moore, William I. Notz, Michael A. FlignerPublisher:W. H. Freeman
 Introduction to the Practice of StatisticsStatisticsISBN:9781319013387Author:David S. Moore, George P. McCabe, Bruce A. CraigPublisher:W. H. Freeman
MATLAB: An Introduction with Applications
Statistics
ISBN:9781119256830
Author:Amos Gilat
Publisher:John Wiley & Sons Inc
Probability and Statistics for Engineering and th...
Statistics
ISBN:9781305251809
Author:Jay L. Devore
Publisher:Cengage Learning
Statistics for The Behavioral Sciences (MindTap C...
Statistics
ISBN:9781305504912
Author:Frederick J Gravetter, Larry B. Wallnau
Publisher:Cengage Learning
Elementary Statistics: Picturing the World (7th E...
Statistics
ISBN:9780134683416
Author:Ron Larson, Betsy Farber
Publisher:PEARSON
The Basic Practice of Statistics
Statistics
ISBN:9781319042578
Author:David S. Moore, William I. Notz, Michael A. Fligner
Publisher:W. H. Freeman
Introduction to the Practice of Statistics
Statistics
ISBN:9781319013387
Author:David S. Moore, George P. McCabe, Bruce A. Craig
Publisher:W. H. Freeman