A First Course in Probability (10th Edition)
10th Edition
ISBN: 9780134753119
Author: Sheldon Ross
Publisher: PEARSON
expand_more
expand_more
format_list_bulleted
Question

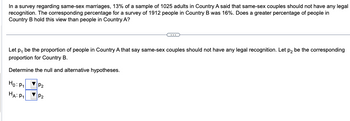
Transcribed Image Text:In a survey regarding same-sex marriages, 13% of a sample of 1025 adults in Country A said that same-sex couples should not have any legal
recognition. The corresponding percentage for a survey of 1912 people in Country B was 16%. Does a greater percentage of people in
Country B hold this view than people in Country A?
Let p, be the proportion of people in Country A that say same-sex couples should not have any legal recognition. Let p₂ be the corresponding
proportion for Country B.
Determine the null and alternative hypotheses.
Ho: P₁
HA: P₁
P₂
P₂
Expert Solution
This question has been solved!
Explore an expertly crafted, step-by-step solution for a thorough understanding of key concepts.
This is a popular solution
Trending nowThis is a popular solution!
Step by stepSolved in 6 steps with 16 images

Knowledge Booster
Similar questions
- Let p be the population proportion for the following condition. Find the point estimates for p and q. A study of 5000 adults from country A, 3256 think mainstream media is more interested in making money than in telling the truth. The point estimate for p. p, is (Round to three decimal places as needed.) The point estimate for q, q, is (Round to three decimal places as needed.)arrow_forwardI am struggling with part B of this question.arrow_forwardSuppose we want to estimate the proportion of the Helena population who have used marijuana within the last month. We select 4328 participants and ask them each to first privately draw a card from a standard 52-card deck. If they get a “club” they are asked to respond truthfully to the question “Have you used marijuana within the last month?”If they get any other suit they are asked to respond to the question “Does your phone number end in an odd digit?”The study is blinded in the sense that the researcher doesn’t know which question the participant is answering. Hence, participants are guaranteed anonymity and are more likely to be truthful in their responses. The researchers only get a “yes” or “no” answer from each respondent and don’t know the actual results of the card draw. What is the expected probability of a person’s phone number ending in an odd digit? What is the expected probability of a person’s phone number not ending in an odd digit?arrow_forward
- 1). The table below gives the responses to 20 questions. Calculate the value of the appropriate used for the answer yes no yes yes yes no no yes no no yes Yes no yes no yes no yes yes yes noarrow_forwardA study was conducted to determine the proportion of people who dream in black and white instead of color. Among 309 people over the age of 55, 77 dream in black and white, and among 309 people under the age of 25, 18 dream in black and white. Use a U.U5 signiticance level to test the claim that the proportion of people over 55 who dream in black and white is greater than the proportion for those under 25 Complete parts (a) through (c) below. Consider the first sample to be the sample of people over the age of 55 and the second sample to be the sample of people under the age of 25. What are the null and alternative hypotheses for the hypothesis test? Identify the test statistic. z= (Round to two decimal places as needed.) Identify the P-value. P-value= (Round to three decimal places as needed.) What is the conclusion based on the hypothesis test? The P-value is ______ the significance level of a = 0.05, so ______ black and white is ____ the proportion for those under 25. There is…arrow_forwardThe manager of a theater that is open to residents of two towns, A and B, wants to know if the proportion of households from A that use the library is smaller than the proportion of households from B. In order to test this, the manager asks 45 households in A and 49 households in B whether anyone in their household had used the theater last summer. 23 of the households surveyed in A responded "yes", and 35 of the households in B responded "yes". Find the p-value that would be used to make a conclusion for this hypothesis test.arrow_forward
- 1a. A recent study (Ackerman, Griskevicius, and Li, 2011) examined expressions of commitment between two partners in a committed romantic relationship. One aspect of the study involved 40 heterosexual couples who were asked about which person was the first to say "I love you." ...the 40 responses were used to see whether the male was more likely to say "I love you" first. 1.c] Write a paragraph, as if to the skeptics and the researchers, describing what your simulation analysis reveals about whether the data provide strong evidence in support of the researchers' conjecture. If you side with the researchers - explain why ... If you side with the skeptics - explain what it would take to be convincing evidence ...arrow_forwardNeed 99% interval for all five countries.arrow_forward
arrow_back_ios
arrow_forward_ios
Recommended textbooks for you
 A First Course in Probability (10th Edition)ProbabilityISBN:9780134753119Author:Sheldon RossPublisher:PEARSON

A First Course in Probability (10th Edition)
Probability
ISBN:9780134753119
Author:Sheldon Ross
Publisher:PEARSON
