
MATLAB: An Introduction with Applications
6th Edition
ISBN: 9781119256830
Author: Amos Gilat
Publisher: John Wiley & Sons Inc
expand_more
expand_more
format_list_bulleted
Related questions
Question
I only need the correct answers for the 2 questions please it’s urgent!!! Thank you
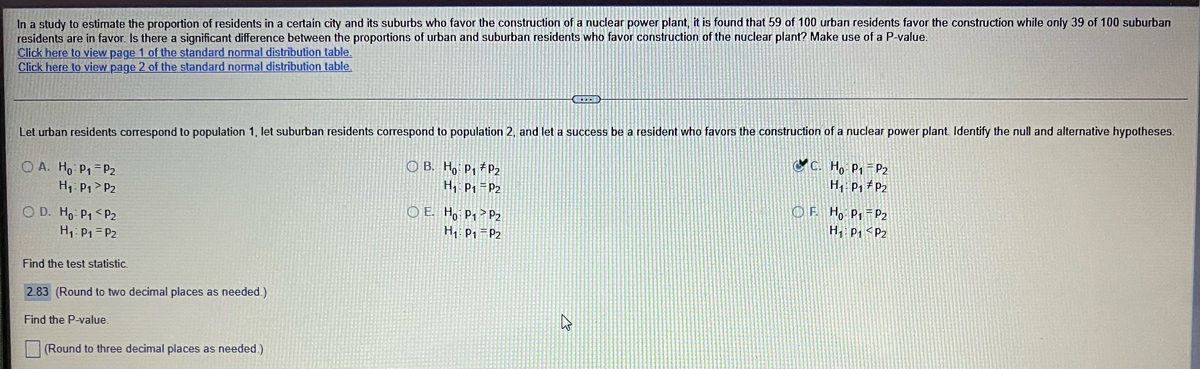

Transcribed Image Text:In a study to estimate the proportion of residents in a certain city and its suburbs who favor the construction of a nuclear power plant, it is found that 59 of 100 urban residents favor the construction while only 39 of 100 suburban
residents are in favor. Is there a significant difference between the proportions of urban and suburban residents who favor construction of the nuclear plant? Make use of a P-value.
Click here to view page 1 of the standard normal distrībution table.
Click here to view page 2 of the standard normal distribution table
Let urban residents correspond to population 1, let suburban residents correspond to population 2, and let a success be a resident who favors the construction of a nuclear power plant. Identify the null and alternative hypotheses
CC. Họ P,-P2
H, P, # P2
O B. Ho P, #P2
O A. Ho P1=P2
H1: P, > P2
H, P =P2
O D. Ho P, <P2
H P1=P2
O E. Ho P, > P2
H P1 =P2
OF Ho Pp =P2
H, P, <Pz
Find the test statistic.
2.83 (Round to two decimal places as needed.)
Find the P-value.
(Round to three decimal places as needed.)

Transcribed Image Text:Five samples of a ferrous-type substance were used to determine if there is a difference between a laboratory chemical analysis and an X-ray fluorescence analysis of the iron content. Each sample was split into two
subsamples and the two types of analysis were applied, with the accompanying results. Assuming that the populations are normal, test at the 0 10 level of significance whether the two methods of analysis give, on the average,
the same result
Click here to view the sample analyses.
Let sample 1 be the X-ray fluorescence results and let sample 2 be the labe
Ho: Ho
= 0
Sample Analyses
H Ho # 0
Identify the critical region. Select the correct choice below and fill in the ans
(Round to three decimal places as needed.)
Sample
3
4
5
Analysis
X-гау
Chemical
2
1.9
2.2
2.1
2.3
2.4
2.4
2.2
O A.
1.8
2.5
2.4
O B
t< -2.132 or t> 2.132
Print
Done
Determine the test statistic
(Round to two decimal places as needed.)
Expert Solution
This question has been solved!
Explore an expertly crafted, step-by-step solution for a thorough understanding of key concepts.

This is a popular solution

Trending nowThis is a popular solution!

Step by stepSolved in 3 steps with 2 images

Knowledge Booster

Similar questions
arrow_back_ios
arrow_forward_ios
Recommended textbooks for you
- MATLAB: An Introduction with ApplicationsStatisticsISBN:9781119256830Author:Amos GilatPublisher:John Wiley & Sons Inc
 Probability and Statistics for Engineering and th...StatisticsISBN:9781305251809Author:Jay L. DevorePublisher:Cengage Learning
 Statistics for The Behavioral Sciences (MindTap C...StatisticsISBN:9781305504912Author:Frederick J Gravetter, Larry B. WallnauPublisher:Cengage Learning
  Elementary Statistics: Picturing the World (7th E...StatisticsISBN:9780134683416Author:Ron Larson, Betsy FarberPublisher:PEARSON
 The Basic Practice of StatisticsStatisticsISBN:9781319042578Author:David S. Moore, William I. Notz, Michael A. FlignerPublisher:W. H. Freeman
 Introduction to the Practice of StatisticsStatisticsISBN:9781319013387Author:David S. Moore, George P. McCabe, Bruce A. CraigPublisher:W. H. Freeman
MATLAB: An Introduction with Applications
Statistics
ISBN:9781119256830
Author:Amos Gilat
Publisher:John Wiley & Sons Inc
Probability and Statistics for Engineering and th...
Statistics
ISBN:9781305251809
Author:Jay L. Devore
Publisher:Cengage Learning
Statistics for The Behavioral Sciences (MindTap C...
Statistics
ISBN:9781305504912
Author:Frederick J Gravetter, Larry B. Wallnau
Publisher:Cengage Learning
Elementary Statistics: Picturing the World (7th E...
Statistics
ISBN:9780134683416
Author:Ron Larson, Betsy Farber
Publisher:PEARSON
The Basic Practice of Statistics
Statistics
ISBN:9781319042578
Author:David S. Moore, William I. Notz, Michael A. Fligner
Publisher:W. H. Freeman
Introduction to the Practice of Statistics
Statistics
ISBN:9781319013387
Author:David S. Moore, George P. McCabe, Bruce A. Craig
Publisher:W. H. Freeman