
Related questions
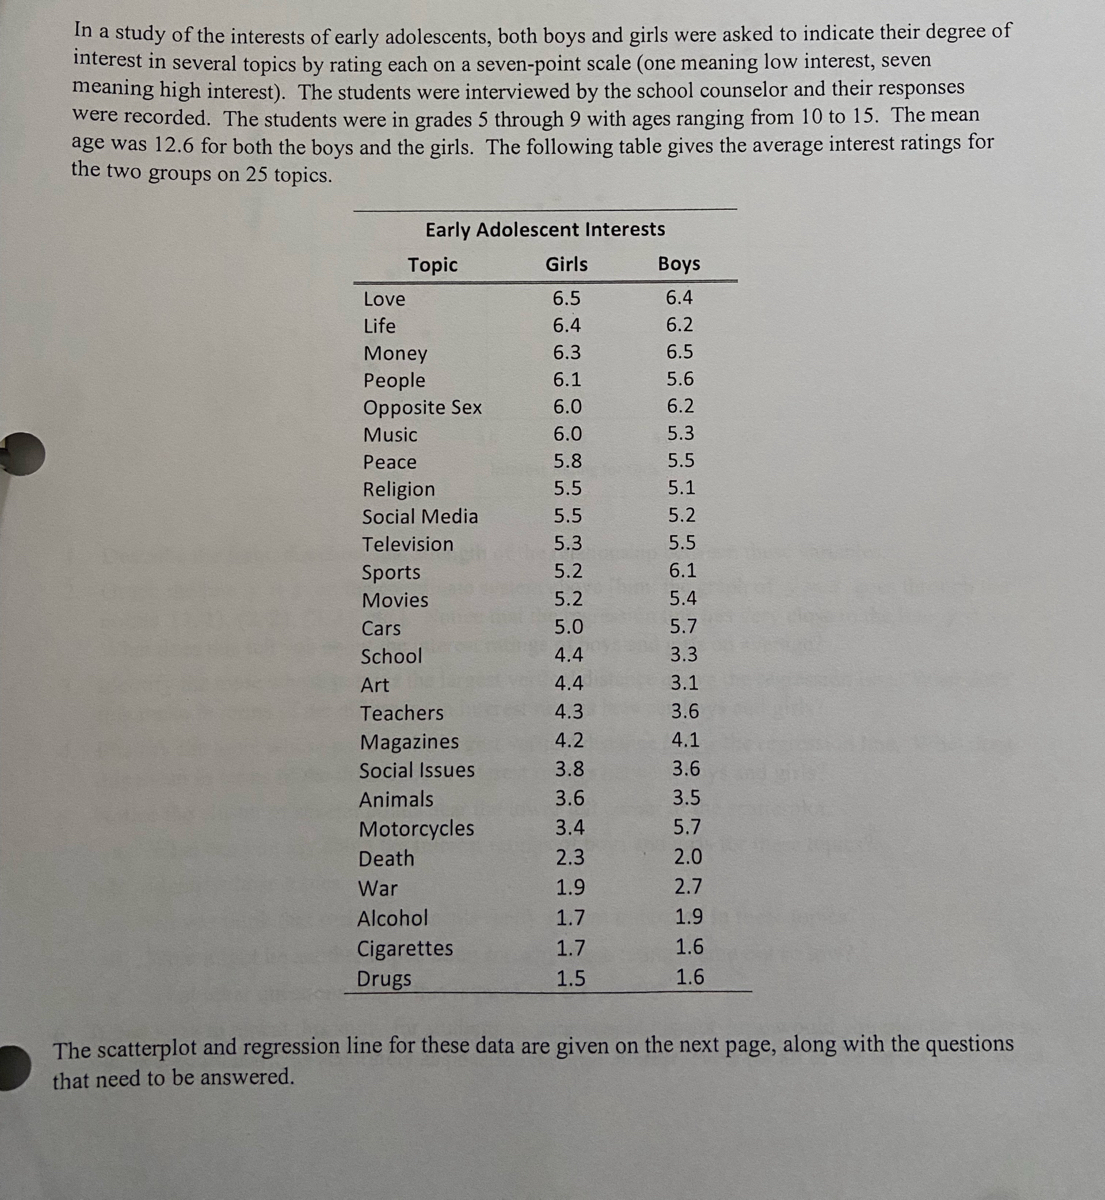

![Interst Rating for Boys
7.0
6.0
5.0
4.0
3.0
2.0
1.0
1.0
2.0
Early Adolescent Interests
3.0
4.0
Interest Rating for Girls
5.0
6.0
7.0
1. Describe the form, direction, and strength of the relationship between these variables.
2.
Graph the line y = x on the coordinate system above [hint: the graph of y = x goes through the
points (1, 1), (2, 2), (3, 3), etc.]. Notice that the regression line lies very close to the line y = x.
What does this tell you about the interest ratings of boys and girls on average?
3. Identify the topic whose point is the largest vertical distance above the regression line. What does
this mean in terms of the difference in interest ratings between boys and girls?
4. Identify the topic whose point is the largest vertical distance below the regression line. What does
this mean in terms of the difference in interest ratings between boys and girls?
5. Notice the cluster of several points near the lower left corner of the scatterplot.
a.
What can you say about the interest ratings of boys and girls for these topics?
b. Identify those topics.
c. Do you think that early adolescents really are not interested in these topics?
d. What might be another explanation for why these ratings came out so low?
e. What other questions might this raise about the results?
6. If you were to repeat this study for students in your school district, how would you plan the study so
that you could learn, as accurately as possible the true interest levels for all of the topics being asked
about?](https://content.bartleby.com/qna-images/question/d7e38a16-ab38-466f-8425-a06e3c07d6d2/e77bd204-ad9d-4c0e-815b-5f4c11a53caf/g1b6wjvv_processed.jpeg)


Trending nowThis is a popular solution!

Step by stepSolved in 6 steps with 3 images

E) what other questions might this raise about the results ?
If you were to repeat this study for students in your school district how would you plan the study so that you can learn, as accurately as possible the true interest levels for all of the topics being asked about?
What can you say about the interest ratings of boys and girls for these topics?
C) do you think that early adolescents really are interested in these topics?

- A statistical program is recommended. The Condé Nast Traveler Gold List provides ratings for the top 20 small cruise ships. The data shown below are the scores each ship received based upon the results from Condé Nast Traveler's Annual Readers' Choice Survey. Each score represents the percentage of respondents who rated a ship as excellent or very good on several criteria, including Shore Excursions and Food/Dining. An overall score was also reported and used to rank the ships. The highest ranked ship, the Seabourn Odyssey, has an overall score of 94.4, the highest component of which is 97.8 for Food/Dining. Shore Ship Overall Food/Dining Excursions Seabourn Odyssey 94.4 90.9 97.8 Seabourn Pride 93.0 84.2 96.7 National Geographic Endeavor 92.9 100.0 88.5 Seabourn Sojourn 91.3 94.8 97.1 Paul Gauguin 90.5 87.9 91.2 Seabourn Legend 90.3 82.1 98.8 Seabourn Spirit 90.2 86.3 92.0 Silver Explorer 89.9 92.6 88.9 Silver Spirit 89.4 85.9 90.8 Seven Seas Navigator 89.2 83.3 90.5 Silver Whisperer…arrow_forwardHow young is too young to have a cell phone? A group of eighth-grade boys and girls were surveyed and asked if they had a cell phone, with the following results. Cell Phone No Cell Phone Boys 54 46 Girls 57 43 (a) Draw a stacked bar chart to describe the data. I Cell Phone I No Cell Phone 1 Cell Phone I No Cell Phone 1 Cell Phone I No Cell Phone Frequency Frequency Frequency 100 100 100 80 80 80 60 60 60 40 40 40 20 20 20 Gender- Gender- Gender Boys Girls Вoys Girls Воys Girls Cell Phone No Cell Phone Frequency 100 80 60 40 20arrow_forwardThe table below shows the grades of the 20 students of a martial arts class. There are three grades: satisfactory(S), unsatisfactory(U), and incomplete(I) Question: Which measure of central tendency is appropriate for the variable? Mode Median Meanarrow_forward
- Jocelyn believes that the amount of sleep she tends to get on weekends differs from the amount of sleep she tends to get during the school week. To investigate this claim, she randomly selects 10 weekend days and 10 school days. She consults her smart watch to determine the number of hours she slept for each of the selected days. Here are the data. School week: 7, 7.5, 8, 6.5, 8, 7.5, 7, 6.5, 7, 8Weekend: 9.5, 9.5, 8.25, 8.5, 7.5, 10.25, 8, 7, 9.5, 10 Jocelyn would like to determine if these data provide convincing evidence that the true mean amount of sleep she gets on the weekend differs from the true mean amount of sleep she gets during the school week. She tests H0: μS – μW = 0, Ha: μS – μW ≠ 0, where μW = the true mean amount of sleep Jocelyn gets on the weekend and μS = the true mean amount of sleep she gets during the school week. The conditions for inference are met. What are the values of the test statistic and P-value for a t-test about a difference in means? Find the…arrow_forwardA researcher is interested in the relationship between age and golf performance. The researcher claims that golf performance improves with age, that is, as one gets older, his or her golf scores decrease. [In golf, a low score represents better performance; a higher score represents worse performance.] The researcher randomly selects a group of eight golfers at the local golf course and records their ages and their most recent golf score. The data that were collected are presented below: Golfer's Name Diego Tiger Bogart Marilyn Jennifer Mitch Bubba Amber Age (years) Variable 1 23 14 38 43 49 36 72 Golf Score Variable 2 92 112 77 84 81 72 79 86 Which of the following are the correct statements of the null and alternate hypotheses, Ho and HA? O Ho: M₁ M₂ and HA: H1 H₂arrow_forwardThe following are the GPAs of 18 r/s SCC students:1.3, 1.5, 1.7, 2.2, 2.5, 2.6, 2.6, 2.6, 2.6, 2.8, 2.9, 2.9, 3.0, 3.1, 3.5, 3.5, 3.6, 3.9(a) Find the 70th percentile of the data.(b) Find the median and Q1and Q3Make sure you properly justify how to find them.(c)Find all outliers using the IQR method d) Draw the box plot of this dataarrow_forward
- The following data were collected in a survey of 8th graders and summarize their cell phone status. What proportion of the 8th graders have cell phones? No cell phone Conventional cell phone Smartphone Boys 50 65 33 Girls 31 76 27arrow_forwardWinston has just gone grocery shopping. The mean cost for each item in his bag was $3.48. He bought a total of 9 items, and the prices of 8 of those items are listed below: $2.75,$4.06,$3.16,$3.92,$4.29,$2.77,$3.01,$4.57 Determine the price of the 9th item in his bag.arrow_forwardDetermine what the key terms refer to in the following study. We want to know the average (mean) amount of money first year college students spend at ABC College on school supplies that do not include books. We randomly surveyed 100 first year students at the college. Three of those students spent $150, $200, and $225, respectively.arrow_forward
- MATLAB: An Introduction with ApplicationsStatisticsISBN:9781119256830Author:Amos GilatPublisher:John Wiley & Sons Inc
 Probability and Statistics for Engineering and th...StatisticsISBN:9781305251809Author:Jay L. DevorePublisher:Cengage Learning
 Statistics for The Behavioral Sciences (MindTap C...StatisticsISBN:9781305504912Author:Frederick J Gravetter, Larry B. WallnauPublisher:Cengage Learning
  Elementary Statistics: Picturing the World (7th E...StatisticsISBN:9780134683416Author:Ron Larson, Betsy FarberPublisher:PEARSON
 The Basic Practice of StatisticsStatisticsISBN:9781319042578Author:David S. Moore, William I. Notz, Michael A. FlignerPublisher:W. H. Freeman
 Introduction to the Practice of StatisticsStatisticsISBN:9781319013387Author:David S. Moore, George P. McCabe, Bruce A. CraigPublisher:W. H. Freeman