
MATLAB: An Introduction with Applications
6th Edition
ISBN: 9781119256830
Author: Amos Gilat
Publisher: John Wiley & Sons Inc
expand_more
expand_more
format_list_bulleted
Related questions
Topic Video
Question
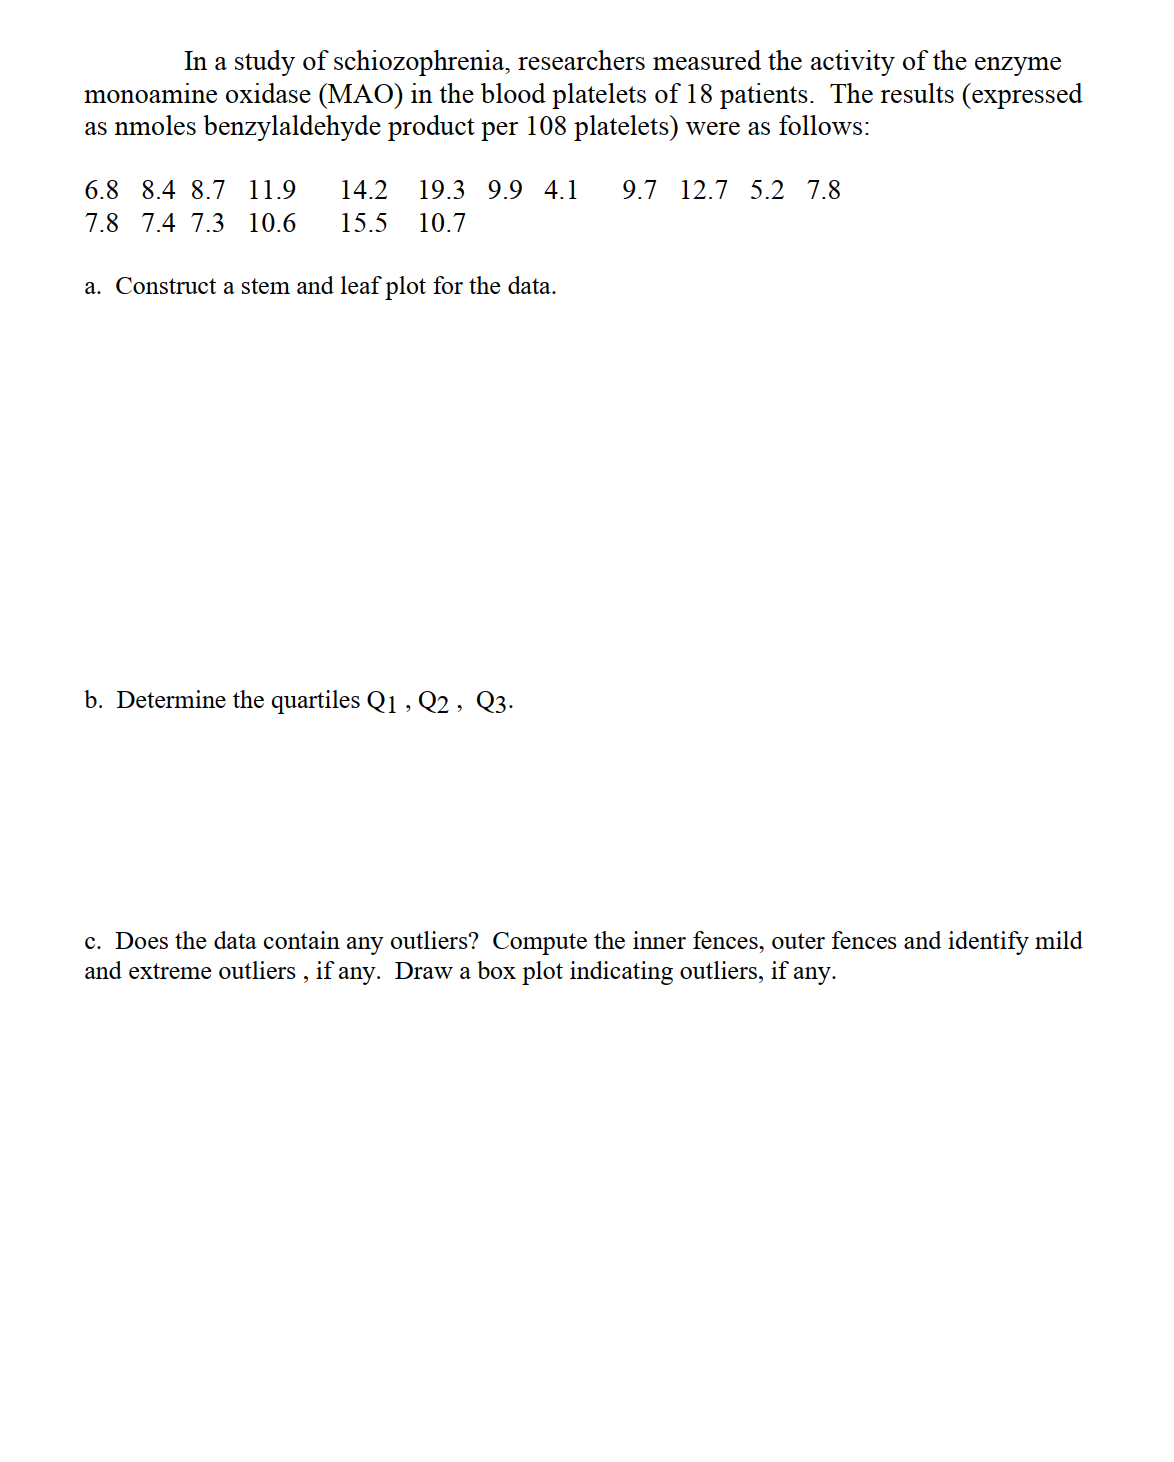

Transcribed Image Text:In a study of schiozophrenia, researchers measured the activity of the enzyme
monoamine oxidase (MAO) in the blood platelets of 18 patients. The results (expressed
as nmoles benzylaldehyde product per 108 platelets) were as follows:
6.8 8.4 8.7 11.9
14.2
19.3 9.9 4.1
9.7 12.7 5.2 7.8
7.8 7.4 7.3 10.6
15.5
10.7
Expert Solution
This question has been solved!
Explore an expertly crafted, step-by-step solution for a thorough understanding of key concepts.

This is a popular solution

Trending nowThis is a popular solution!

Step by stepSolved in 4 steps with 4 images

Knowledge Booster


Learn more about
Need a deep-dive on the concept behind this application? Look no further. Learn more about this topic, statistics and related others by exploring similar questions and additional content below.Similar questions
- The owner of a new car conducts a series of six gas mileage tests and obtains the following results, expressed in miles per gallon: 3., 22.7, 21.4, 20.6, and 21.4. 20.9. Find the mode for these data.arrow_forwardAn automobile dealer conducted a test to determine if the time in minutes needed to complete a minor engine tune-up depends on whether a computerized engine analyzer or an electronic analyzer is used. Because tune-up time varies among compact, intermediate, and full-sized cars, the three types of cars were used as blocks in the experiment. The data obtained follow. Analyzer Computerized Electronic Compact 50 41 Car Intermediate 56 44 Full-sized 62 47 Use a = 0.05 to test for any significant differences. State the null and alternative hypotheses. O Ho: Hcompact * HIntermediate * HFull-sized Ha: "Compact = HIntermediate = 4Full-sized O Ho: HComputerized * HElectronic Ha: HComputerized = HElectronic O Ho: HComputerized = HElectronic Ha: "Computerized * HElectronic O Ho: HComputerized = HElectronic = "Compact = HIntermediate = "Full-sized H.: Not all the population means are equal. O Ho: HCompact = HIntermediate = HFull-sized Hai H compact * HIntermediate * HFull-sized Find the value of…arrow_forwardInorganic phosphorous is a naturally occurring element in all plants and animals, with concentrations increasing progressively up the food chain (fruit < vegetables < cereals < nuts < corpse). Geochemical surveys take soil samples to determine phosphorous content (in ppm, parts per million). A high phosphorous content may or may not indicate an ancient burial site, food storage site, or even a garbage dump. Independent random samples from two regions gave the following phosphorous measurements (in ppm). Assume the distribution of phosphorous is mound-shaped and symmetric for these two regions. Region I: x,; n, = 15 875 1,080 2,330 1,850 1,860 853 1,551 1,230 2,340 1,080 910 1,130 1,450 1,260 1,010 Region II: x,; n, = 14 540 808 790 1,230 1,770 960 1,650 860 890 640 1,180 1,160 1,050 | 1,020 In USE SALT (a) Use a calculator with mean and standard deviation keys to verify that x,, S,, x2, and s,. (Round your answers to four decimal places.) X1 ppm S. = ppm X2 ppm 52 ppm (b) Let u, be the…arrow_forward
- A deficiency of the trace element selenium in the diet can negatively impact growth, immunity, muscle and neuromuscular function, and fertility. The introduction of selenium supplements to dairy cows is justified when pastures have low selenium levels. Authors of a research paper supplied the following data on milk selenium concentration (mg/L) for a sample of cows given a selenium supplement (the treatment group) and a control sample given no supplement, both initially and after a 9-day period. Initial Measurement Treatment Control 11.4 9.1 9.6 8.7 10.1 9.7 8.5 10.8 10.2 10.9 10.6 10.6 11.9 10.1 9.9 12.3 10.7 8.8 10.2 10.4 10.3 10.9 11.4 10.4 9.3 11.6 10.6 10.9 10.9 8.3 After 9 Days Treatment Control 138.3 9.2 104 8.9 96.4 8.9 89 10.1 88 9.6 103.8 8.6 147.3 10.4 97.1 12.4 172.6 9.2 146.3 9.5 99 8.4 122.3 8.8 103 12.5 117.8 9.1 121.5 93 (a) Use the given data for the treatment group to determine if…arrow_forwardThe following data was reported on total Fe for four types of iron formation (1 carbonate, 2 silicate, 3 magnetite, 4 hematite). 1: 21.0 28.1 27.8 27.0 27,8 25.2 25.3 27.1 20.5 31.5 2: 26.2 24.0 26.2 20.2 23.6 34.0 17.1 26.8 23.7 25.0 3: 29.6 34.0 27.5 29.4 26.4 26.2 29.9 29.5 30.0 35.5 4: 37.1 44,2 34.1 30.3 31.8 33.134.1 32.9 36,3 25.3 A USE SALT Carry out an analysis of variance F test at significance level 0.01. State the appropriate hypotheses. H at least two 's are equal Ho Hi= Ha = H4 H at least two 's are unequal O Ho = = 4 H al four s are unequal H all four 's are equalarrow_forwardListed below are amounts of strontium-90 (in millibecquerels, or mBq) in a simple random sample of baby teeth obtained from residents in a region born after 1979. Use the given data to construct a boxplot and identify the 5-number summary. 148 125 152 130 155 141 164 172 all in mBq. The 5-number summary is .... and (Use ascending order. Type integers or decimals. Do not round.) Which boxplot below represents the data? О А. о с. 127 154 120 TH 100 120 140 160 180 200 Strontium-90 (mBq) 140 160 180 Strontium-90 (mBq) 200 Q Q Q 134. 156 137 157 OB. O D. 100 120 142 166 120 140 160 180 200 Strontium-90 (mBq) 140 160 Strontium-90 (mBq) 180 Q Q Q 144 168 150 D 177arrow_forward
- Listed below are amounts of strontium-90 (in millibecquerels, or mBq) in a simple random sample of baby teeth obtained from residents in a region born after 1979. Use the given data to construct a boxplot and identify the 5-number summary. 124 149 125 149 O A. 120 128 149 100 131 152 The 5-number summary is 124, 135, 147, 156.5, and 172, all in mBq. (Use ascending order. Type integers or decimals. Do not round.) Which boxplot below represents the data? 140 160 Strontium-90 (mBq) 180 133 154 120 140 160 180 200 Strontium-90 (mBq) 137 159 O B. 137 162 D. 120 100 138 163 142 167 140 160 Strontium-90 (mBq) 180 120 140 160 180 Strontium-90 (mBq) 200 200 145 D 172arrow_forward11.3.5arrow_forwardTo evaluate the coagulation effects of three drugs, 30 healthy volunteers were randomly assigned into 3 groups and injected with different drugs. Their relevant coagulation times were measured as follows A(group=1): 36.8 34.4 34.3 35.7 33.2 31.1 34.3 29.8 35.4 31.2B(group=2): 40.0 35.5 36.7 39.3 40.1 36.8 33.4 38.3 38.4 39.8C(group=3): 32.9 37.9 30.5 31.1 34.7 37.6 40.2 38.1 32.4 35.6Questions: ① If you want to evaluate whether the coagulation effects of the three drugs are different, which method should be used? and what are the model assumptionsfor the application of this method?② Compare the difference of the coagulation effects among three drugs by SPSS,present the main results and make interpretation.③ Make pairwise comparisons of the efficacy of the three drugs, write out the method of pairwise comparison you adopted (just write one method) and the corresponding p-values.arrow_forward
arrow_back_ios
arrow_forward_ios
Recommended textbooks for you
- MATLAB: An Introduction with ApplicationsStatisticsISBN:9781119256830Author:Amos GilatPublisher:John Wiley & Sons Inc
 Probability and Statistics for Engineering and th...StatisticsISBN:9781305251809Author:Jay L. DevorePublisher:Cengage Learning
 Statistics for The Behavioral Sciences (MindTap C...StatisticsISBN:9781305504912Author:Frederick J Gravetter, Larry B. WallnauPublisher:Cengage Learning
  Elementary Statistics: Picturing the World (7th E...StatisticsISBN:9780134683416Author:Ron Larson, Betsy FarberPublisher:PEARSON
 The Basic Practice of StatisticsStatisticsISBN:9781319042578Author:David S. Moore, William I. Notz, Michael A. FlignerPublisher:W. H. Freeman
 Introduction to the Practice of StatisticsStatisticsISBN:9781319013387Author:David S. Moore, George P. McCabe, Bruce A. CraigPublisher:W. H. Freeman
MATLAB: An Introduction with Applications
Statistics
ISBN:9781119256830
Author:Amos Gilat
Publisher:John Wiley & Sons Inc
Probability and Statistics for Engineering and th...
Statistics
ISBN:9781305251809
Author:Jay L. Devore
Publisher:Cengage Learning
Statistics for The Behavioral Sciences (MindTap C...
Statistics
ISBN:9781305504912
Author:Frederick J Gravetter, Larry B. Wallnau
Publisher:Cengage Learning
Elementary Statistics: Picturing the World (7th E...
Statistics
ISBN:9780134683416
Author:Ron Larson, Betsy Farber
Publisher:PEARSON
The Basic Practice of Statistics
Statistics
ISBN:9781319042578
Author:David S. Moore, William I. Notz, Michael A. Fligner
Publisher:W. H. Freeman
Introduction to the Practice of Statistics
Statistics
ISBN:9781319013387
Author:David S. Moore, George P. McCabe, Bruce A. Craig
Publisher:W. H. Freeman