
MATLAB: An Introduction with Applications
6th Edition
ISBN: 9781119256830
Author: Amos Gilat
Publisher: John Wiley & Sons Inc
expand_more
expand_more
format_list_bulleted
Related questions
Question
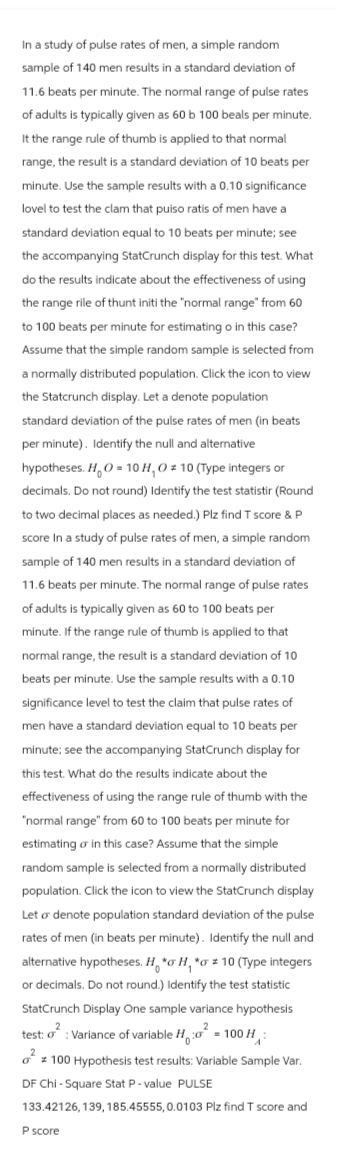

Transcribed Image Text:In a study of pulse rates of men, a simple random
sample of 140 men results in a standard deviation of
11.6 beats per minute. The normal range of pulse rates
of adults is typically given as 60 b 100 beals per minute.
It the range rule of thumb is applied to that normal
range, the result is a standard deviation of 10 beats per
minute. Use the sample results with a 0.10 significance
lovel to test the clam that puiso ratis of men have a
standard deviation equal to 10 beats per minute; see
the accompanying StatCrunch display for this test. What
do the results indicate about the effectiveness of using
the range rile of thunt initi the "normal range from 60
to 100 beats per minute for estimating o in this case?
Assume that the simple random sample is selected from
a normally distributed population. Click the icon to view
the Statcrunch display. Let a denote population
standard deviation of the pulse rates of men (in beats
per minute). Identify the null and alternative
hypotheses. H₂O = 10 H, O 10 (Type integers or
decimals. Do not round) Identify the test statistir (Round
to two decimal places as needed.) Plz find T score & P
score In a study of pulse rates of men, a simple random
sample of 140 men results in a standard deviation of
11.6 beats per minute. The normal range of pulse rates
of adults is typically given as 60 to 100 beats per
minute. If the range rule of thumb is applied to that
normal range, the result is a standard deviation of 10
beats per minute. Use the sample results with a 0.10
significance level to test the claim that pulse rates of
men have a standard deviation equal to 10 beats per
minute; see the accompanying StatCrunch display for
this test. What do the results indicate about the
effectiveness of using the range rule of thumb with the
"normal range" from 60 to 100 beats per minute for
estimating or in this case? Assume that the simple
random sample is selected from a normally distributed
population. Click the icon to view the StatCrunch display
Let o denote population standard deviation of the pulse
rates of men (in beats per minute). Identify the null and
alternative hypotheses. Ha H, a # 10 (Type integers
or decimals. Do not round.) Identify the test statistic
StatCrunch Display One sample variance hypothesis
2
test: o: Variance of variable H
-100 H
²100 Hypothesis test results: Variable Sample Var.
DF Chi-Square Stat P-value PULSE
133.42126, 139, 185.45555, 0.0103 Plz find T score and
P score
Expert Solution
This question has been solved!
Explore an expertly crafted, step-by-step solution for a thorough understanding of key concepts.

This is a popular solution

Trending nowThis is a popular solution!

Step by stepSolved in 3 steps with 5 images

Knowledge Booster

Similar questions
- Does it take a different amount of time for seeds to germinate if they are near rock music that is continuously playing compared to being near classical music? The 48 seeds that were exposed to rock music took an average of 28 days to germinate. The standard deviation was 13 days. The 47 seeds that were exposed to classical music took an average of 32 days to germinate. The standard deviation for these seeds was 10 days. What can be concluded at the a - 0.01 level of significance? a. For this study, we should use Select an answer b. The null and alternative hypotheses would be: Ho: Select an answer Select an answers Select an answerv (please enter a decimal) Hị: Select an answer Select an answer Select an answer v (Please enter a decimal) c. The test statistic ?- (please show your answer to 3 decimal places.) d. The p-value- (Please show your answer to 4 decimal places.) e. The p-value is ? a f. Based on this, we should Select g. Thus, the final conclusion is that . answer v the null…arrow_forwardThe mean score on a driving exam for a group of drivers education students is 72 points with a standard deviation of 6 points. apply Chebyshev theorem to the data using K=2. Interpret the results. Simplify answer.arrow_forwardOne of the measurements used to determine the health of a person's lungs is the amount of air a person can exhale under force in one second. This is called forced expiratory volume in one second, and is abbreviated FEV,. Assume the mean FEV, for 10-year-old boys is 2.1 liters that the population standard deviation is o =0.2. A random sample of 53 10-year-old boys live in a community with high levels of ozone pollution are found to have a sample mean FEV, of 2.09 liters. Can you conclude that the mean FEV, in the high-pollution community differs from 2.1 liters? (A) Yes (B) Noarrow_forward
- The mean score on a driving exam for a group of driver's education students is 6868 points, with a standard deviation of 55 points. Apply Chebychev's Theorem to the data using kequals=22. Interpret the resultsarrow_forwardIn the 1800s, German physician Carl Reinhold, took millions of axillary (i.e. armpit) temperatures from soldiers. This study established that body temperature is normally distributed and the standard normal human body temperature is 98.6°F with a standard deviation of 0.72 °F. In a recent study, American researchers obtained 5,000 axillary temperatures from a Los Angeles hospital. The mean of these temperature readings was 97.9 °F. Assuming a Type I error risk of no more than 5%, did the findings support the theory that human, body temperature has decreased since the 1800s? What is the Z crit?arrow_forwardThe average labor charge for automobile mechanics is OMR 69 per hour. The standard deviation is OMR 18. Find the minimum percentage of data values that will fall within the range of OMR 68 to OMR 80. Use Chebyshev's theorem. SHOW ALL THE WORKINGS, FORMULA etc.arrow_forward
- The standard deviation of pulse rates of adult males is less than 10 bpm. For a random sample of 144 adult males, the pulse rates have a standard deviation of 9.1 bpm. Find the value of the test statistic.arrow_forwardA researcher believes the mean weight of males sulcata tortoises is more than 205 pounds. She samples 18 males sulcatas and find their mean to be 216.2 pounds with a standard deviation of 13.5pounds. Find the p-value p =arrow_forwardThe time to smoke fish is normally distributed with an average of 5.3 hours and a standard deviation of 2.1 hours. What is the z score for a fish that take 10 hours to smoke?arrow_forward
- It takes an average of 14.5 minutes for blood to begin clotting after an injury. An EMT wants to see if the average will increase if the patient is immediately told the truth about the injury. The EMT randomly selected 70 injured patients to immediately tell the truth about the injury and noticed that they averaged 16.3 minutes for their blood to begin clotting after their injury. Their standard deviation was 4.75 minutes. What can be concluded at the the α = 0.10 level of significance? a. For this study, we should use [Select an answer b. The null and alternative hypotheses would be: Ho: ? Select an answer H₁: ? Select an answer ✓ c. The test statistic ? = (please show your answer to 3 decimal places.) d. The p-value = (Please show your answer to 4 decimal places.) e. The p-value is ? ✓ a f. Based on this, we should [Select an answer the null hypothesis. g. Thus, the final conclusion is that ... O The data suggest the populaton mean is significantly greater than 14.5 at a = 0.10, so…arrow_forwarda data set has a mean of 210 and a standard deviation of 40, what is the z- Score for a ralue of140 Ifarrow_forwardForty refrigerators from two different models of a refrigerator manufacturer are compared to see if the smaller model uses less energy than the larger model. The energy was measured in kilowatt hours per month (kwh/mo). From years of testing these models, it is known that the standard deviation of kwh/mo is 34 kwh/mo for the smaller model and 40 kwh/mo for the larger one. From this survey, the sample means and standard deviations are 125 and 34, and 90 and 40, respectively. If we conduct a hypothesis test, the decision and conclusion are Group of answer choices Do not reject the null hypothesis and conclude that the average kwh/mo are the same. Reject the null hypothesis and conclude that the average kwh/mo are different. Reject the null hypothesis and conclude that the average kwh/mo for the smaller refrigerator is higher than for the larger model. Do not reject the null hypothesis and conclude that the average kwh/mo for the smaller refrigerator is higher than for…arrow_forward
arrow_back_ios
SEE MORE QUESTIONS
arrow_forward_ios
Recommended textbooks for you
- MATLAB: An Introduction with ApplicationsStatisticsISBN:9781119256830Author:Amos GilatPublisher:John Wiley & Sons Inc
 Probability and Statistics for Engineering and th...StatisticsISBN:9781305251809Author:Jay L. DevorePublisher:Cengage Learning
 Statistics for The Behavioral Sciences (MindTap C...StatisticsISBN:9781305504912Author:Frederick J Gravetter, Larry B. WallnauPublisher:Cengage Learning
  Elementary Statistics: Picturing the World (7th E...StatisticsISBN:9780134683416Author:Ron Larson, Betsy FarberPublisher:PEARSON
 The Basic Practice of StatisticsStatisticsISBN:9781319042578Author:David S. Moore, William I. Notz, Michael A. FlignerPublisher:W. H. Freeman
 Introduction to the Practice of StatisticsStatisticsISBN:9781319013387Author:David S. Moore, George P. McCabe, Bruce A. CraigPublisher:W. H. Freeman
MATLAB: An Introduction with Applications
Statistics
ISBN:9781119256830
Author:Amos Gilat
Publisher:John Wiley & Sons Inc
Probability and Statistics for Engineering and th...
Statistics
ISBN:9781305251809
Author:Jay L. Devore
Publisher:Cengage Learning
Statistics for The Behavioral Sciences (MindTap C...
Statistics
ISBN:9781305504912
Author:Frederick J Gravetter, Larry B. Wallnau
Publisher:Cengage Learning
Elementary Statistics: Picturing the World (7th E...
Statistics
ISBN:9780134683416
Author:Ron Larson, Betsy Farber
Publisher:PEARSON
The Basic Practice of Statistics
Statistics
ISBN:9781319042578
Author:David S. Moore, William I. Notz, Michael A. Fligner
Publisher:W. H. Freeman
Introduction to the Practice of Statistics
Statistics
ISBN:9781319013387
Author:David S. Moore, George P. McCabe, Bruce A. Craig
Publisher:W. H. Freeman