
MATLAB: An Introduction with Applications
6th Edition
ISBN: 9781119256830
Author: Amos Gilat
Publisher: John Wiley & Sons Inc
expand_more
expand_more
format_list_bulleted
Related questions
Question
What kind of test is used for this problem? How is it solved step by step?
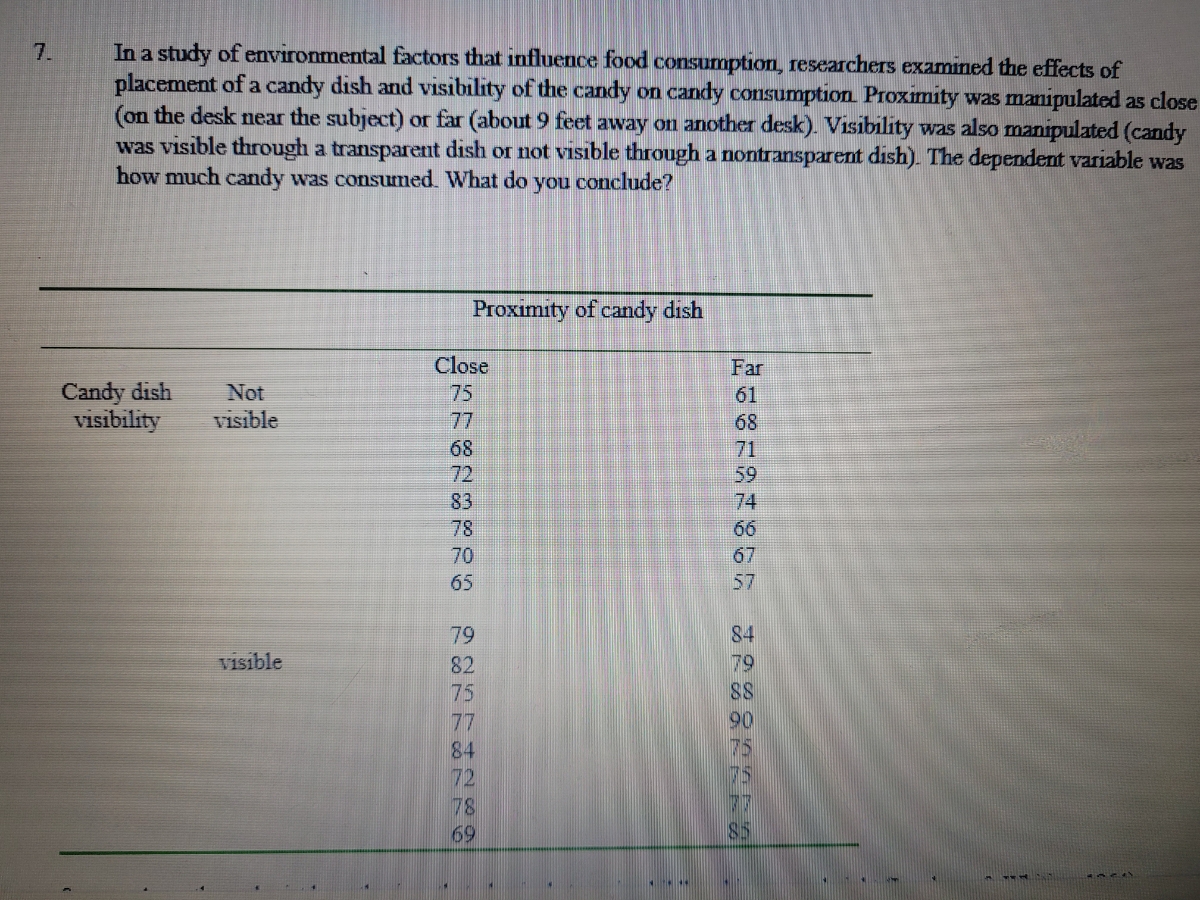

Transcribed Image Text:In a study of environmental factors that influence food consumption, researchers examined the effects of
placement of a candy dish and visibility of the candy on candy consumption Proximity was manipulated as close
(on the desk near the subject) or far (about 9 feet away on another desk). Visibility was also manipulated (candy
was visible through a transparent dish or not visible througha nontransparent dish). The dependent variable was
how much candy was consumed. What do you conclude?
7.
Proximity of candy dish
Close
Far
Candy dish
visibility
Not
75
61
visible
77
68
68
71
72
59
83
74
78
66
70
67
65
57
79
84
Visible
82
79
75
88
90
77
84
72
78
69
Expert Solution
This question has been solved!
Explore an expertly crafted, step-by-step solution for a thorough understanding of key concepts.

This is a popular solution

Trending nowThis is a popular solution!

Step by stepSolved in 2 steps

Knowledge Booster


Learn more about
Need a deep-dive on the concept behind this application? Look no further. Learn more about this topic, statistics and related others by exploring similar questions and additional content below.Similar questions
- You want to determine the effect of soap on bacterial colonies. In order to make sure that the environment does not affect your experiment, you divide 13 different petri dishes in half - one side is exposed to soap, the other is a control. You may use R but please show all the steps and codes involved. You measure the number of colonies that grow in each petri dish and come up with the following results: petri dish: 1 2 3 4 5 6 7 8 9 10 11 12 13soap: 10 5 7 10 19 11 13 17 19 8 11 10 16control: 20 17 11 17 26 18 21 25 24 17 17 17 21 Perform a complete hypothesis test to see if there is a difference in bacterial colonies between the soap and control dishes.arrow_forwardI would like help with question 2 both A and B.arrow_forwardHello, I'm not sure how to solve for the p-value in this questionarrow_forward
- How do I compute this answer?arrow_forwardWhat are the Four Steps to use when working with the t-test ?arrow_forwardHi, could you please solve Question 3 using R? For the questions, use the data I provided in the screenshot. (I would like to upload the data, but the program does not let me) Please, write the codes with the explanations. Thank you.arrow_forward
- (a) What experimental design would be the best to use in the following situation? Be specific. Explain the good features of your proposed design. A taste panel will convene this afternoon to compare six different brands of ice cream. The panel is comprised of 10 persons who are expert tasters. The maximum number of different brands that an individual taster will taste is 3. (b) What would you do if three of the expert tasters failed to come this afternoon because of illness so that you could not run the design recommended in (a) above?arrow_forwardQ9 Needed to be solved correctly in 30 minutes and get the thumbs up please show neat and clean workarrow_forwardHello. Can I get help on how to work this problem? Thank You!arrow_forward
- i need the answer quicklyarrow_forwardALREADY HAVE FIRST THREE ANSWERS NEED THE REST. ANOVA. Dr. Milgram is conducting a patient satisfaction survey, rating how well her patients like her on a scale of 1-10. Her patients tend to fall into three categories: “Like a lot”, “like somewhat”, and “dislike a lot”. She believes that she might get different satisfaction scores from people in each group, but (because she's not great at numbers) she wants you to do an ANOVA to be sure. She has collected data from 12 patients (three equal groups) with the following results. Group 1) “Like a lot” Mean: 8 SS: 2 N: df: Group 2) “Like somewhat” Mean: 5 SS: 6 N: df: Group 3) “Dislike a lot” Mean: 2 SS: 4 N: df: Grand Mean: 4 df Within-Group: 9 df Between-Groups: 2 Estimated Variance (S21) for Group 1: _______ Estimated Variance (S22)…arrow_forwardYou want to determine if there is a difference in the number of times statistics students get asked out on dates compared to biology students. You randomly survey four statistics students and four biology students. Data are listed on the table. Statistics Biology students studentsX Y8 144 108 64 10Conduct an independent t-test to see if there is a significant difference. (Be sure to complete all 4 steps.)arrow_forward
arrow_back_ios
SEE MORE QUESTIONS
arrow_forward_ios
Recommended textbooks for you
- MATLAB: An Introduction with ApplicationsStatisticsISBN:9781119256830Author:Amos GilatPublisher:John Wiley & Sons Inc
 Probability and Statistics for Engineering and th...StatisticsISBN:9781305251809Author:Jay L. DevorePublisher:Cengage Learning
 Statistics for The Behavioral Sciences (MindTap C...StatisticsISBN:9781305504912Author:Frederick J Gravetter, Larry B. WallnauPublisher:Cengage Learning
  Elementary Statistics: Picturing the World (7th E...StatisticsISBN:9780134683416Author:Ron Larson, Betsy FarberPublisher:PEARSON
 The Basic Practice of StatisticsStatisticsISBN:9781319042578Author:David S. Moore, William I. Notz, Michael A. FlignerPublisher:W. H. Freeman
 Introduction to the Practice of StatisticsStatisticsISBN:9781319013387Author:David S. Moore, George P. McCabe, Bruce A. CraigPublisher:W. H. Freeman
MATLAB: An Introduction with Applications
Statistics
ISBN:9781119256830
Author:Amos Gilat
Publisher:John Wiley & Sons Inc
Probability and Statistics for Engineering and th...
Statistics
ISBN:9781305251809
Author:Jay L. Devore
Publisher:Cengage Learning
Statistics for The Behavioral Sciences (MindTap C...
Statistics
ISBN:9781305504912
Author:Frederick J Gravetter, Larry B. Wallnau
Publisher:Cengage Learning
Elementary Statistics: Picturing the World (7th E...
Statistics
ISBN:9780134683416
Author:Ron Larson, Betsy Farber
Publisher:PEARSON
The Basic Practice of Statistics
Statistics
ISBN:9781319042578
Author:David S. Moore, William I. Notz, Michael A. Fligner
Publisher:W. H. Freeman
Introduction to the Practice of Statistics
Statistics
ISBN:9781319013387
Author:David S. Moore, George P. McCabe, Bruce A. Craig
Publisher:W. H. Freeman