
MATLAB: An Introduction with Applications
6th Edition
ISBN: 9781119256830
Author: Amos Gilat
Publisher: John Wiley & Sons Inc
expand_more
expand_more
format_list_bulleted
Related questions
Question
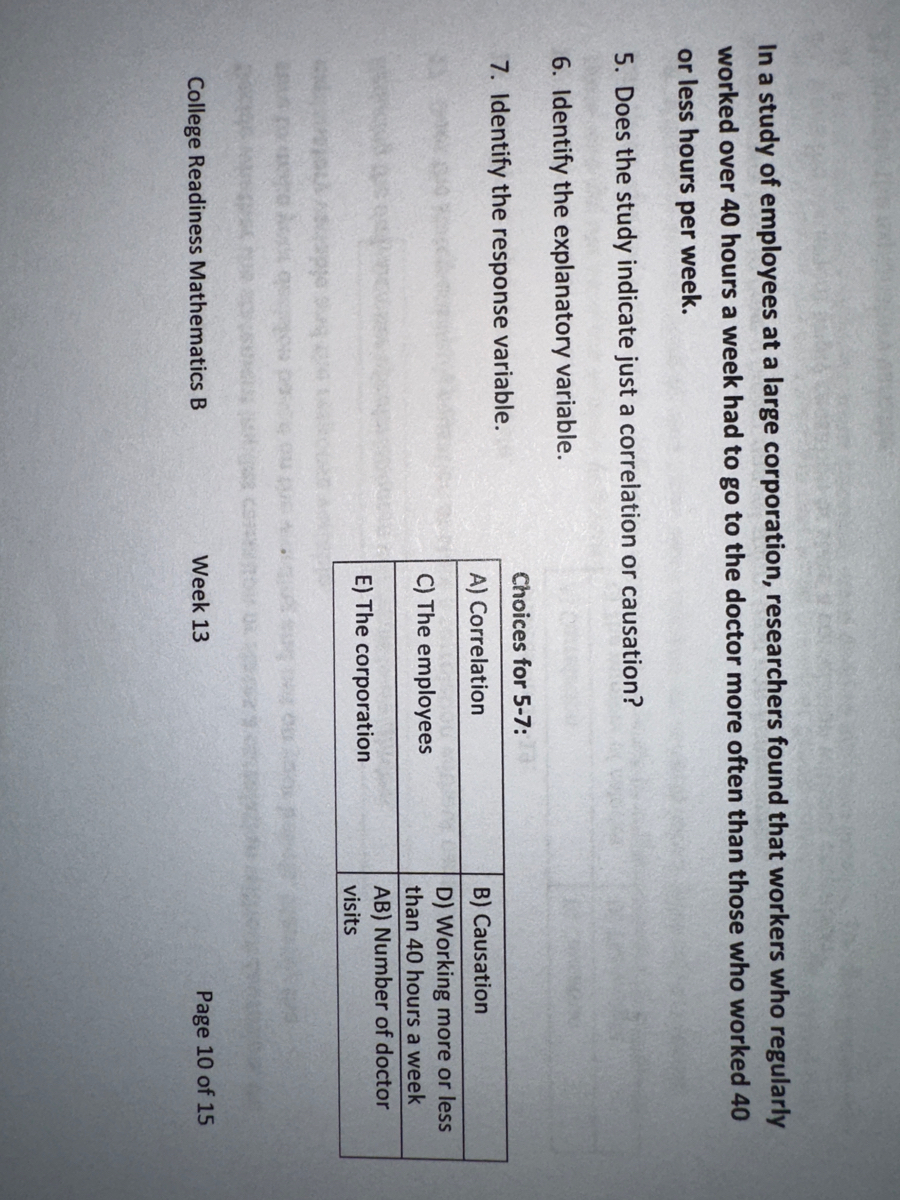

Transcribed Image Text:In a study of employees at a large corporation, researchers found that workers who regularly
worked over 40 hours a week had to go to the doctor more often than those who worked 40
or less hours per week.
5. Does the study indicate just a correlation or causation?
6. Identify the explanatory variable.
7. Identify the response variable.
College Readiness Mathematics B
Choices for 5-7:
A) Correlation
C) The employees
E) The corporation
Week 13
B) Causation
D) Working more or less
than 40 hours a week
AB) Number of doctor
visits
Page 10 of 15
Expert Solution
This question has been solved!
Explore an expertly crafted, step-by-step solution for a thorough understanding of key concepts.

Step by stepSolved in 3 steps

Knowledge Booster

Similar questions
- A teacher is concerned that she may be biased in her interaction with students. She keeps track of the number of interactions she has with her students and also notes the student's gender. She records the results in a contingency table. Interaction YES NO Boy 7 13 Girl 15 Is there a significant relationship between the interactions and the student's gender, using a = .05?arrow_forwardIn a study of the effects of the drug THC on driving performance, driving performance would be the Independent variable. a. true b. falsearrow_forward1.6 How would you rank cities? Various organizations rank cities and produce lists of the 10 or the 100 best cities, based on various measures. Create a list of criteria that you would use to rank cities. Include at least eight variables and give reasons for your choices. Say whether each variable is quantitative or categorical.arrow_forward
- Suppose you have collected data on 1000 customers who visited your company's website last week. For each customer, the time spent on the page and the total amount of customer purchases during the visit were recorded. You want to explore the relationship between these two variables. What is the explanatory variable and what is the response variable? to. Explanatory: Time spent on the page Answer: Total amount of purchases b. It is not possible since neither explains c. Answer: Time spent on the page Explanatory: Total amount of purchasesarrow_forward11. A manager of a department times how many hours each person works within her department. 43 42 24 50 41 28 47 47 39 59 29 31 39 42 What is the mean and median of the data? Group of answer choices Mean = 40.1; Median = 41.5 Mean = 40.0; Median = 42.5 Mean = 40; Median = 42 Mean = 40.8; Median = 47arrow_forwardSelect the most appropriate response. A university statistician found that the correlation between college GPA and starting salary was 0.12. Based on this you would tell the university that: a) GPA is a good predictor of starting salary. b) students with low GPA’s will have the lowest starting salaries. c) GPA is a poor predictor of starting salary. d) students with high GPA’s will have the highest starting salariesarrow_forward
- 4. time to try out multiple predictor variables. take a look at the data shown here, where the outcome is becoming a great chef. we suspect that variables such as number of years of experience cooking, level of formal culinary education, and number of different positions (sous chef, pasta station, etc.) all contribute to rankings or scores on the great chef test. a. which are the best predictors of a chef’s score? b. what score can you expect from a person with 12 years of experience and a level 2 education who has held five positions?arrow_forwardProvide an appropriate response. Suppose you were to collect data for the pair of given variables in order to make a scatterplot. For the variables time spent on homework and exam grade, which is more naturally the response variable and which is the explanatory variable? O Time spent on homework: response variable Exam grade: explanatory variable O Time spent on homework: explanatory variable Exam grade: response variablearrow_forward1arrow_forward
- 1. Interpret the following graph. The variables of interest are narcissism (on a 1-5 scale), and random assignment to read a code of ethics or inoculation condition. The dependent variable is how ethical someone was in the past week, averaged into a 1-5 scale. Honest over the past week 5 4.5 4 3.5 Low Narcissism High Narcissism Code of Ethics Inoculationarrow_forwardCan I get some help with identifying the variables and individuals?arrow_forwardCan you identify the explanatory variable and the response? Let me know which response is correct.arrow_forward
arrow_back_ios
SEE MORE QUESTIONS
arrow_forward_ios
Recommended textbooks for you
- MATLAB: An Introduction with ApplicationsStatisticsISBN:9781119256830Author:Amos GilatPublisher:John Wiley & Sons Inc
 Probability and Statistics for Engineering and th...StatisticsISBN:9781305251809Author:Jay L. DevorePublisher:Cengage Learning
 Statistics for The Behavioral Sciences (MindTap C...StatisticsISBN:9781305504912Author:Frederick J Gravetter, Larry B. WallnauPublisher:Cengage Learning
  Elementary Statistics: Picturing the World (7th E...StatisticsISBN:9780134683416Author:Ron Larson, Betsy FarberPublisher:PEARSON
 The Basic Practice of StatisticsStatisticsISBN:9781319042578Author:David S. Moore, William I. Notz, Michael A. FlignerPublisher:W. H. Freeman
 Introduction to the Practice of StatisticsStatisticsISBN:9781319013387Author:David S. Moore, George P. McCabe, Bruce A. CraigPublisher:W. H. Freeman
MATLAB: An Introduction with Applications
Statistics
ISBN:9781119256830
Author:Amos Gilat
Publisher:John Wiley & Sons Inc
Probability and Statistics for Engineering and th...
Statistics
ISBN:9781305251809
Author:Jay L. Devore
Publisher:Cengage Learning
Statistics for The Behavioral Sciences (MindTap C...
Statistics
ISBN:9781305504912
Author:Frederick J Gravetter, Larry B. Wallnau
Publisher:Cengage Learning
Elementary Statistics: Picturing the World (7th E...
Statistics
ISBN:9780134683416
Author:Ron Larson, Betsy Farber
Publisher:PEARSON
The Basic Practice of Statistics
Statistics
ISBN:9781319042578
Author:David S. Moore, William I. Notz, Michael A. Fligner
Publisher:W. H. Freeman
Introduction to the Practice of Statistics
Statistics
ISBN:9781319013387
Author:David S. Moore, George P. McCabe, Bruce A. Craig
Publisher:W. H. Freeman