
MATLAB: An Introduction with Applications
6th Edition
ISBN: 9781119256830
Author: Amos Gilat
Publisher: John Wiley & Sons Inc
expand_more
expand_more
format_list_bulleted
Related questions
Concept explainers
Question
thumb_up100%
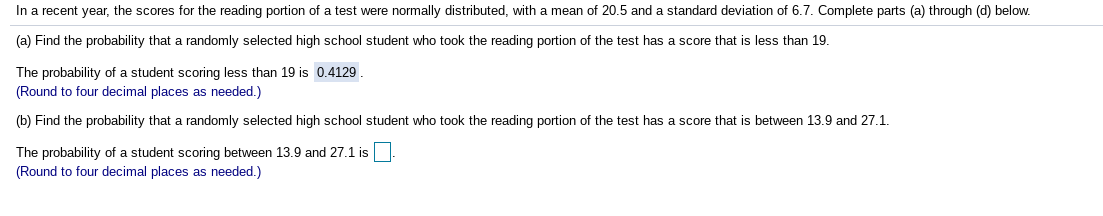

Transcribed Image Text:In a recent year, the scores for the reading portion of a test were normally distributed, with a mean of 20.5 and a standard deviation of 6.7. Complete parts (a) through (d) below.
(a) Find the probability that a randomly selected high school student who took the reading portion of the test has a score that is less than 19.
The probability of a student scoring less than 19 is 0.4129
(Round to four decimal places as needed.)
(b) Find the probability that a randomly selected high school student who took the reading portion of the test has a score that is between 13.9 and 27.1.
The probability of a student scoring between 13.9 and 27.1 is
(Round to four decimal places as needed.)
Expert Solution
This question has been solved!
Explore an expertly crafted, step-by-step solution for a thorough understanding of key concepts.

This is a popular solution

Trending nowThis is a popular solution!

Step by stepSolved in 2 steps with 3 images

Knowledge Booster


Learn more about
Need a deep-dive on the concept behind this application? Look no further. Learn more about this topic, statistics and related others by exploring similar questions and additional content below.Similar questions
- The mean is 146 and the standard deviation is 35. A score of 41 is how many z-scores below the mean?arrow_forwardThe average amount of money spent for lunch per person in the college cafeteria is $6.24 and the standard deviation is $2.05. Suppose that 6 randomly selected lunch patrons are observed. Assume the distribution of money spent is normal, and round all answers to 4 decimal places where possible.What is the distribution of ¯x?arrow_forwardUse z scores to compare the given values. The tallest living man at one time had a height of 238 cm. The shortest living man at that time had a height of 142.4 cm. Heights of men at that time had a mean of 175.45 cm and a standard deviation of 5.59 cm. Which of these two men had the height that was more extreme? ... Since the z score for the tallest man is z = 0 and the z score for the shortest man is z = the man had the height that was Im- more extreme. (Round to two decimal places.) shortest tallestarrow_forward
- On the final exam in a large statistics class the average score was 76 with a standard deviation of 7. Assuming a normal population, what scores were so deviant that their probability of occurrence was .01 or less? Choose the best answer. (Hint: .005 in each tail)arrow_forwardThe board of examiners that administers the real estate broker’s examination in a certain state found that the mean score on the test was 450 and the standard deviation was 50. If the board wants to set the passing scores so that only the top 5% of all applicants pass, what should the passing score be? Assume that the scores are normally distributed.arrow_forward2000 freshmen at state university took a biology test. the scores were normally distributed with a mean of 70 and a standard deviation of 5. Use z scores. (1) the percent of students that scored less than 77arrow_forward
arrow_back_ios
arrow_forward_ios
Recommended textbooks for you
- MATLAB: An Introduction with ApplicationsStatisticsISBN:9781119256830Author:Amos GilatPublisher:John Wiley & Sons Inc
 Probability and Statistics for Engineering and th...StatisticsISBN:9781305251809Author:Jay L. DevorePublisher:Cengage Learning
 Statistics for The Behavioral Sciences (MindTap C...StatisticsISBN:9781305504912Author:Frederick J Gravetter, Larry B. WallnauPublisher:Cengage Learning
  Elementary Statistics: Picturing the World (7th E...StatisticsISBN:9780134683416Author:Ron Larson, Betsy FarberPublisher:PEARSON
 The Basic Practice of StatisticsStatisticsISBN:9781319042578Author:David S. Moore, William I. Notz, Michael A. FlignerPublisher:W. H. Freeman
 Introduction to the Practice of StatisticsStatisticsISBN:9781319013387Author:David S. Moore, George P. McCabe, Bruce A. CraigPublisher:W. H. Freeman
MATLAB: An Introduction with Applications
Statistics
ISBN:9781119256830
Author:Amos Gilat
Publisher:John Wiley & Sons Inc
Probability and Statistics for Engineering and th...
Statistics
ISBN:9781305251809
Author:Jay L. Devore
Publisher:Cengage Learning
Statistics for The Behavioral Sciences (MindTap C...
Statistics
ISBN:9781305504912
Author:Frederick J Gravetter, Larry B. Wallnau
Publisher:Cengage Learning
Elementary Statistics: Picturing the World (7th E...
Statistics
ISBN:9780134683416
Author:Ron Larson, Betsy Farber
Publisher:PEARSON
The Basic Practice of Statistics
Statistics
ISBN:9781319042578
Author:David S. Moore, William I. Notz, Michael A. Fligner
Publisher:W. H. Freeman
Introduction to the Practice of Statistics
Statistics
ISBN:9781319013387
Author:David S. Moore, George P. McCabe, Bruce A. Craig
Publisher:W. H. Freeman