
MATLAB: An Introduction with Applications
6th Edition
ISBN: 9781119256830
Author: Amos Gilat
Publisher: John Wiley & Sons Inc
expand_more
expand_more
format_list_bulleted
Related questions
Question
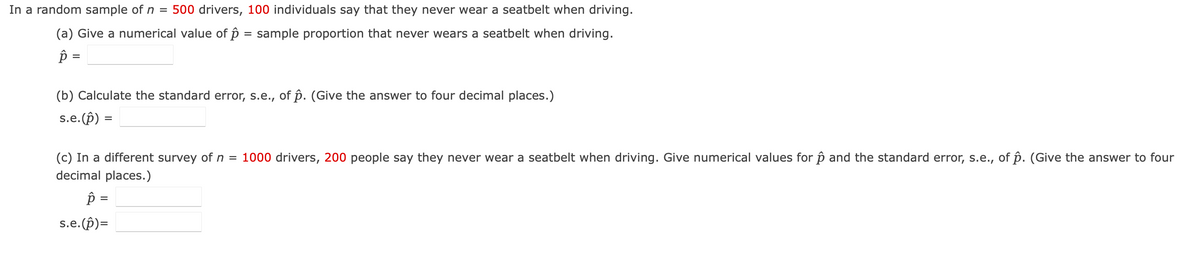

Transcribed Image Text:In a random sample of n = 500 drivers, 100 individuals say that they never wear a seatbelt when driving.
(a) Give a numerical value of p = sample proportion that never wears a seatbelt when driving.
p =
(b) Calculate the standard error, s.e., of p. (Give the answer to four decimal places.)
s.e.(p) =
(c) In a different survey of n = 1000 drivers, 200 people say they never wear a seatbelt when driving. Give numerical values for p and the standard error, s.e., of p. (Give the answer to four
decimal places.)
Ŕ
=
s.e.(p)=
SAVE
AI-Generated Solution
info
AI-generated content may present inaccurate or offensive content that does not represent bartleby’s views.
Unlock instant AI solutions
Tap the button
to generate a solution
to generate a solution
Click the button to generate
a solution
a solution
Knowledge Booster

Similar questions
- Q7. Select the best response. We take a simple random sample (SRS) from a population to studythe effect of marital status (married vs. not married on systolic blood pressure. Which t procedureshould we use? A. a one-sample t procedure B. a paired t procedure C. ANOVA D. None of the abovearrow_forwardThe following data represent the responses (Y for yes and N for no) from a sample of 20 college students to the question "Do you currently own shares in any stocks?" ΝΝΝΝΥΥΥΥΝΝΥΝΝΥΥΝΥΝΥΝΕ a. Determine the sample proportion, p, of college students who own shares of stock. b. If the population proportion is 0.35, determine the standard error of the proportion. a. p= b. Op = (Round to two decimal places as needed.) (Round to four decimal places as needed.)arrow_forwardIn a random sample of n = 300 adults, 171 individuals say that they believe in love at first sight. LOOK AT IMAGE FOR QUESTIONSarrow_forward
- For this problem, carry at least four digits after the decimal in your calculations. Answers may vary slightly due to rounding.The National Council of Small Businesses is interested in the proportion of small businesses that declared Chapter 11 bankruptcy last year. Since there are so many small businesses, the National Council intends to estimate the proportion from a random sample. Let p be the proportion of small businesses that declared Chapter 11 bankruptcy last year. (a) If no preliminary sample is taken to estimate p, how large a sample is necessary to be 95% sure that a point estimate p̂ will be within a distance of 0.09 from p? (Round your answer up to the nearest whole number.) small businesses(b) In a preliminary random sample of 30 small businesses, it was found that six had declared Chapter 11 bankruptcy. How many more small businesses should be included in the sample to be 95% sure that a point estimate p̂ will be within a distance of 0.090 from p? (Round your answer…arrow_forward31)arrow_forwardE Tnfanticide an ove... In a certain school district, it was observed that 25% of the students in the element schools were classified as only children (no siblings). However, in the special program for talented and gifted children, 107 out of 336 students are only children. The school district administrators want to know if the proportion of only children in the special program is significantly different from the proportion for the school district. Test at the a 0.02 level of significance. What is the hypothesized population proportion for this test? (Report answer as a decimal accurate to 2 decimal places. Do not report using the percent symbol.) Based on the statement of this problem, how many tails would this hypothesis test have? O one-tailed test O two-tailed test Choose the correct pair of hypotheses for this situation: (A) (B) (C) Ho:p = 0.25 H:p 0.25 0.25 (D) (E) (F) 0.318 Ho:p Ha:p < 0.318 H:p# 0.318 Ha:p Ho:P 0.318 Ho:p 0.318 0.318 (A) (B) (C) (D) (E) (F) Using the normal…arrow_forward
- Samuel F.B. Morse (1791-1872), the creator of the Morse Code, claimed that 12 % of all letters used in English language were "e"s. Suppose random samples of 196 letters are selected from a book. Use this information to answer question belowarrow_forwardThe first four deviations from the mean in a sample of n = 5 reaction times were 0.1, 0.5, 1.1, and 1.5. What is the fifth deviation from the mean? Give a sample for which these are the five deviations from the mean. О -3.1, -2.7, -2.1, -1.7, -3.2 O 1.1, -0.5, 2.1, 2.5, -4.2 О 3.3, 3.7, 4.3, 4.7, 0 О -0.9, -0.5, 0.1, 0.5, 0arrow_forwardIn a study of religious practices among college students, a random sample of 127 students were interviewed; 107 of the students said that they pray at least once in a while. What is the numerical value of the statistic p̂ that estimates p? 1.187 0.107 0.127 0.843arrow_forward
- Homa An education researcher claims that 60% of college students work year-round. In a random sample of 300 college students, 180 say they work year-round. Al a=0.05, is there enough evidence to reject the researcher's claim? Complete parts (a) through (e) below. O C. Atleast % of college students work year-round. book OD. The percentage of college students who work year-round is not %. cer Contents Let p be the population proportion of successes, where a success is a college student who works year-round. State Ho and H. Select the correct choice below and fill in the answer boxes to complete your choice. (Round to two decimal places as needed.) O A. Ho p# GB. H, p=0.60 media Library OC. Ho P Plan OF. Ho ps H, p Tor Success (b) Find the critical value(s) and identify the rejection region(s). sible Resources Identify the critical value(s) for this test. for Success %3D (Round to two decimal places as needed. Use a comma to separate answers as needed.) Clear all Check answer View an…arrow_forwardA sampling distribution (dotplot) for the mean quiz score for a sample n = 30 of STAT101 students is shown below. It was constructed using random samples from population data. If we increased our sample size from 30 to 100, would the standard error of the sample mean be larger, smaller, or the same? Explain your answer in one or two sentences.arrow_forwardFor this problem, carry at least four digits after the decimal in your calculations. Answers may vary slightly due to rounding. The National Council of Small Businesses is interested in the proportion of small businesses that declared Chapter 11 bankruptcy last year. Since there are so many small businesses, the National Council intends to estimate the proportion from a random sample. Let p be the proportion of small businesses that declared Chapter 11 bankruptcy last year. (a) If no preliminary sample is taken to estimate p, how large a sample is necessary to be 99% sure that a point estimate p will be within a distance of 0.08 from p? (Round you answer up to the nearest whole number.) ]× small businesses (b) In a preliminary random sample of 30 small businesses, it was found that eleven had declared Chapter 11 bankruptcy. How many more small businesses should be included in the sample to be 99% sure that a point estimate p will be within a distance of 0.080 from p? (Round your answer…arrow_forward
arrow_back_ios
SEE MORE QUESTIONS
arrow_forward_ios
Recommended textbooks for you
- MATLAB: An Introduction with ApplicationsStatisticsISBN:9781119256830Author:Amos GilatPublisher:John Wiley & Sons Inc
 Probability and Statistics for Engineering and th...StatisticsISBN:9781305251809Author:Jay L. DevorePublisher:Cengage Learning
 Statistics for The Behavioral Sciences (MindTap C...StatisticsISBN:9781305504912Author:Frederick J Gravetter, Larry B. WallnauPublisher:Cengage Learning
  Elementary Statistics: Picturing the World (7th E...StatisticsISBN:9780134683416Author:Ron Larson, Betsy FarberPublisher:PEARSON
 The Basic Practice of StatisticsStatisticsISBN:9781319042578Author:David S. Moore, William I. Notz, Michael A. FlignerPublisher:W. H. Freeman
 Introduction to the Practice of StatisticsStatisticsISBN:9781319013387Author:David S. Moore, George P. McCabe, Bruce A. CraigPublisher:W. H. Freeman
MATLAB: An Introduction with Applications
Statistics
ISBN:9781119256830
Author:Amos Gilat
Publisher:John Wiley & Sons Inc
Probability and Statistics for Engineering and th...
Statistics
ISBN:9781305251809
Author:Jay L. Devore
Publisher:Cengage Learning
Statistics for The Behavioral Sciences (MindTap C...
Statistics
ISBN:9781305504912
Author:Frederick J Gravetter, Larry B. Wallnau
Publisher:Cengage Learning
Elementary Statistics: Picturing the World (7th E...
Statistics
ISBN:9780134683416
Author:Ron Larson, Betsy Farber
Publisher:PEARSON
The Basic Practice of Statistics
Statistics
ISBN:9781319042578
Author:David S. Moore, William I. Notz, Michael A. Fligner
Publisher:W. H. Freeman
Introduction to the Practice of Statistics
Statistics
ISBN:9781319013387
Author:David S. Moore, George P. McCabe, Bruce A. Craig
Publisher:W. H. Freeman