MATLAB: An Introduction with Applications
6th Edition
ISBN: 9781119256830
Author: Amos Gilat
Publisher: John Wiley & Sons Inc
expand_more
expand_more
format_list_bulleted
Question
Please help solve and explain how the answers where derived. I want to understand the procedure. Thank you!

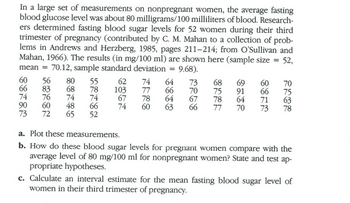
Transcribed Image Text:In a large set of measurements on nonpregnant women, the average fasting
blood glucose level was about 80 milligrams/100 milliliters of blood. Research-
ers determined fasting blood sugar levels for 52 women during their third
trimester of pregnancy (contributed by C. M. Mahan to a collection of prob-
lems in Andrews and Herzberg, 1985, pages 211-214; from O'Sullivan and
Mahan, 1966). The results (in mg/100 ml) are shown here (sample size = 52,
mean = 70.12, sample standard deviation = 9.68).
60
66
56 80 55
68
78
74
74
48
66
65
52
83
74 76
90
60
73 72
62
103
67
74
74 64
66
78
64
60 63
77
75 707 66
68 75 78 7
73
67
77
69
91
64
70
60 66 71 73
70 75 6 78
63
a. Plot these measurements.
b. How do these blood sugar levels for pregnant women compare with the
average level of 80 mg/100 ml for nonpregnant women? State and test ap-
propriate hypotheses.
c. Calculate an interval estimate for the mean fasting blood sugar level of
women in their third trimester of pregnancy.
Expert Solution
This question has been solved!
Explore an expertly crafted, step-by-step solution for a thorough understanding of key concepts.
This is a popular solution
Trending nowThis is a popular solution!
Step by stepSolved in 7 steps with 1 images

Knowledge Booster
Similar questions
arrow_back_ios
arrow_forward_ios
Recommended textbooks for you
 MATLAB: An Introduction with ApplicationsStatisticsISBN:9781119256830Author:Amos GilatPublisher:John Wiley & Sons Inc
 Probability and Statistics for Engineering and th...StatisticsISBN:9781305251809Author:Jay L. DevorePublisher:Cengage Learning
 Statistics for The Behavioral Sciences (MindTap C...StatisticsISBN:9781305504912Author:Frederick J Gravetter, Larry B. WallnauPublisher:Cengage Learning
 Elementary Statistics: Picturing the World (7th E...StatisticsISBN:9780134683416Author:Ron Larson, Betsy FarberPublisher:PEARSON
 The Basic Practice of StatisticsStatisticsISBN:9781319042578Author:David S. Moore, William I. Notz, Michael A. FlignerPublisher:W. H. Freeman
 Introduction to the Practice of StatisticsStatisticsISBN:9781319013387Author:David S. Moore, George P. McCabe, Bruce A. CraigPublisher:W. H. Freeman

MATLAB: An Introduction with Applications
Statistics
ISBN:9781119256830
Author:Amos Gilat
Publisher:John Wiley & Sons Inc

Probability and Statistics for Engineering and th...
Statistics
ISBN:9781305251809
Author:Jay L. Devore
Publisher:Cengage Learning

Statistics for The Behavioral Sciences (MindTap C...
Statistics
ISBN:9781305504912
Author:Frederick J Gravetter, Larry B. Wallnau
Publisher:Cengage Learning

Elementary Statistics: Picturing the World (7th E...
Statistics
ISBN:9780134683416
Author:Ron Larson, Betsy Farber
Publisher:PEARSON

The Basic Practice of Statistics
Statistics
ISBN:9781319042578
Author:David S. Moore, William I. Notz, Michael A. Fligner
Publisher:W. H. Freeman

Introduction to the Practice of Statistics
Statistics
ISBN:9781319013387
Author:David S. Moore, George P. McCabe, Bruce A. Craig
Publisher:W. H. Freeman