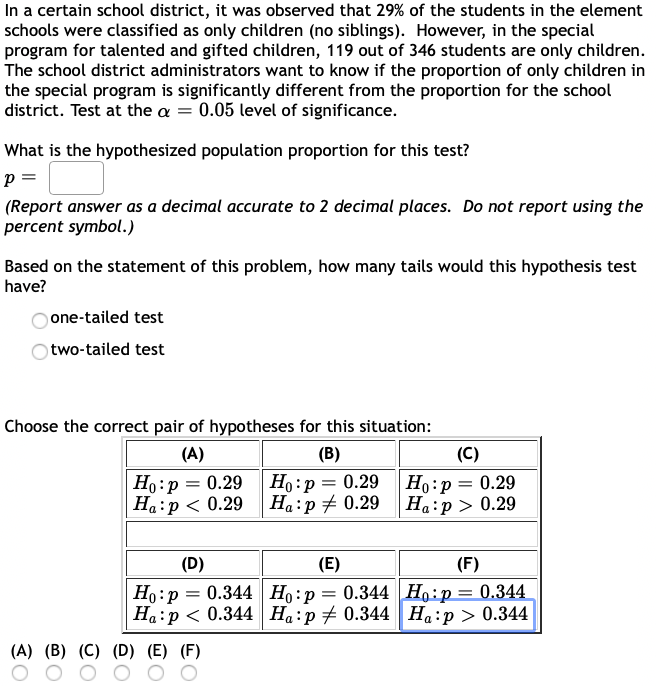


Determine the hypothesized population proportion for the given test.
The hypothesized population proportion for the given test is determined below:
From the information, given that 29% of the student in the element schools were classified as only children.
Thus, the hypothesized population proportion for the given test is 0.29.
Determine the tail of the test for the given hypothesis test.
From the information, given the claim is proportion of the children in the special program is significantly different from the proportion for the district.
Thus, it is clear that direction of the tail for the given hypothesis test is two tailed
State the hypotheses.

That is, there is no evidence that the proportion of the children in the special program is significantly different from the proportion for the district

That is, there is evidence that the proportion of the children in the special program is significantly different from the proportion for the district
Decision rule:

Correct option: Option B.
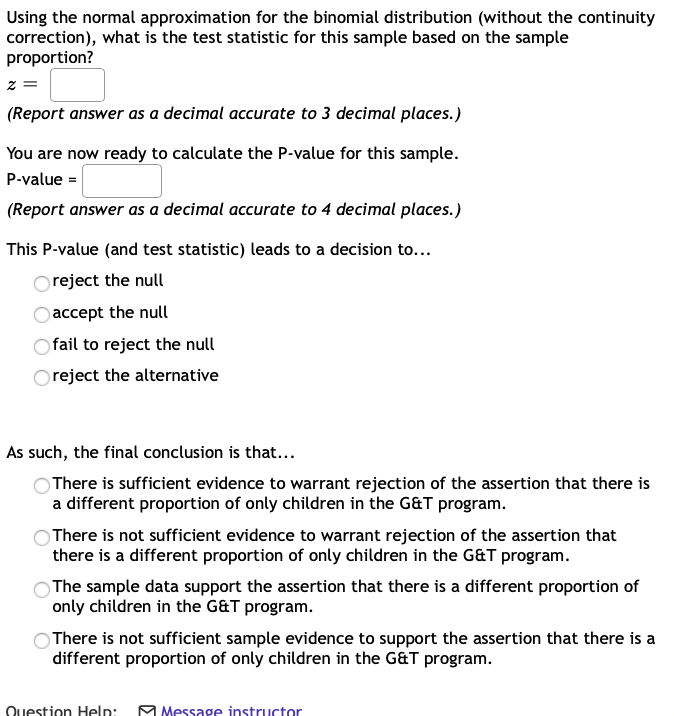
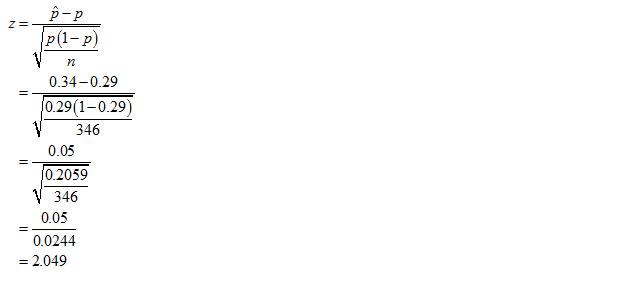
Obtain the value of the test statistic.
The value of the test statistic is obtained below:
From the information, given that
The required value is,

Thus, the value of the test statistic is 2.049
Step by stepSolved in 7 steps with 6 images

- A die is rolled 120 times to see if it is fair. The table below shows the frequencies for each of the six possible outcomes. Use a level of significance of a = 0.10. a. Complete the rest of the table by filling in the expected frequencies (enter your answers in fraction form): Frequency of Dice Values Outcome Frequency Expected Frequency 1 20 20 11 20 3 25 20 4 23 20 20 20 6 20 21arrow_forwardSuppose that the efficacy of a certain drug is 0.43. Consider the sampling distribution (sample size n = 180) for the proportion of patients cured by this drug. What is the mean of this distribution? 0.43 What is the standard error of this distribution? Round your answer to two decimal places. 0.57 X Enter an integer or decimal number [more..]arrow_forward. A researcher wishes to test the claim that the average cost of tuition and fees at a four year public college is greater than $5700. She selects a random sample of 36 four-year public colleges and finds the mean to be $5950. The population standard deviation is $659. Is there evidence to support the claim at 0.05? STEP 3. The test-value z0 is: z0 = (Round to two decimal places.)arrow_forward
- Suppose there is a binomial distribution with: n=63 and p= 0.38 . Answer the questions. Round answers to 3 decimal places. What is the mean of the binomial distribution? What is the variance of the binomial distribution? What is the standard deviation of the binomial distribution?arrow_forwardThe prices of a sample of books at University A were obtained by two statistics students. Then the cost of books for the same subjects (at the same level) were obtained for University B. Assume that the distribution of differences is Normal enough to proceed, and assume that the sampling was random. 1. Find the test statistic for this test. t = ___ (Round to two decimal places as needed.) 2. Find the p-value for this test. p-value = ____ (Round to three decimal places as needed.) 3. What is the conclusion for this test?arrow_forwardA large tank of fish from a hatchery is being delivered to a lake. The hatchery claims that the mean length of fish in the tank is 15 inches, and the standard deviation is 5 inches. A random sample of 41 fish is taken from the tank. Let x be the mean sample length of these fish. What is the probability that x is within 0.5 inch of the claimed population mean? (Round your answer to four decimal places.)arrow_forward
- Which of the following is not one of the assumptions of the t-test for independent samples? The populations of raw scores form at least a roughly normal distribution. They can only be done on Tuesdays. There is homogeneity of variance. There are two independent samples of interval/ratioscores.arrow_forwardYou want to test whether or not the following sample of 30 observations follows a normal distribution. The mean the sample equals 11.83, and the standard deviation equals 4.53. of 2 3 5 5 7 8 8 9 9 10 11 11 12 12 12 12 13 13 13 14 15 15 15 16 16 17 17 18 18 19 (A) The number of intervals or categories used to test the hypothesis for this problem is 6 (B) The expected frequency in the 2nd interval is 10 (C) The calculated value for the test statistic is 5 (D) The p-value is greater than 0.1 (E) a=0.05, the conclusion of the test is that the data follows a normal distributionarrow_forward
 MATLAB: An Introduction with ApplicationsStatisticsISBN:9781119256830Author:Amos GilatPublisher:John Wiley & Sons Inc
 Probability and Statistics for Engineering and th...StatisticsISBN:9781305251809Author:Jay L. DevorePublisher:Cengage Learning
 Statistics for The Behavioral Sciences (MindTap C...StatisticsISBN:9781305504912Author:Frederick J Gravetter, Larry B. WallnauPublisher:Cengage Learning
 Elementary Statistics: Picturing the World (7th E...StatisticsISBN:9780134683416Author:Ron Larson, Betsy FarberPublisher:PEARSON
 The Basic Practice of StatisticsStatisticsISBN:9781319042578Author:David S. Moore, William I. Notz, Michael A. FlignerPublisher:W. H. Freeman
 Introduction to the Practice of StatisticsStatisticsISBN:9781319013387Author:David S. Moore, George P. McCabe, Bruce A. CraigPublisher:W. H. Freeman


