MATLAB: An Introduction with Applications
6th Edition
ISBN: 9781119256830
Author: Amos Gilat
Publisher: John Wiley & Sons Inc
expand_more
expand_more
format_list_bulleted
Concept explainers
Topic Video
Question
thumb_up100%
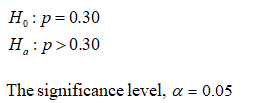
In a 2005 study 2205 adolescents aged 12 - 19 years old were give a treadmill test to check their cardiovascular health. 750 of the subjects were determined to have poor cardiovascular fitness. The researchers want to claim that more than 30% of adolescents have poor cardiovascular health (with a 5% level of significance).
The research hypothesis is Ha : p > 0.30.
Complete the test by computing the test statistic, the p-value, and stating your conclusions.
Expert Solution
arrow_forward
Step 1
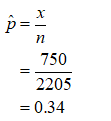
Given,

The sample proportion is,

The null and alternative hypothesis is:

arrow_forward
Step 2
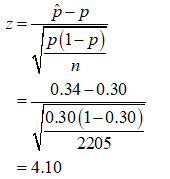
Calculate test statistic:
Under the null hypothesis, the test statistic for one sample proportion is,

Compute P-value:

Step by stepSolved in 3 steps with 6 images

Knowledge Booster
Learn more about
Need a deep-dive on the concept behind this application? Look no further. Learn more about this topic, statistics and related others by exploring similar questions and additional content below.Similar questions
- A clinical trial is conducted to compare a new pain re- liever for arthritis to a placebo. Participants are randomly assigned to receive the new medication or a placebo, and the outcome is pain relief within 30 minutes. The data are shown in Table 7–8. Is there a significant difference in the proportions of patients reporting pain relief? Run the test at a 5% level of significance. Pain Relief No Pain Relief New Medication 44 76 Placebo 21 99 How would I use excel with this?arrow_forwardA credit score is used by credit agencies (such as mortgage companies and banks) to assess the creditworthiness of individuals. Values range from 300 to 850, with a credit score over 700 considered to be a quality credit risk. According to a survey, the mean credit score is 704.5. A credit analyst wondered whether high-income individuals (incomes in excess of $100,000 per year) had higher credit scores. He obtained a random sample of 36 high-income individuals and found the sample mean credit score to be 714.9 with a standard deviation of 81.7. Conduct the appropriate test to determine if high-income individuals have higher credit scores at the a = 0.05 level of significance. State the null and alternative hypotheses. Ho: H V H1: H V (Type integers or decimals. Do not round.) Identify the t-statistic. to (Round to two decimal places as needed.) Identify the P-value. P-value = (Round to three decimal places as needed.) Make a conclusion regarding the hypothesis. V the null hypothesis.…arrow_forwardAcne is a common skin disease that affects most adolescents and can continue into adulthood. A study compared the effectiveness of three acne treatments and a placebo, all in gel form, applied twice daily for 12 weeks. The study's 517 teenage volunteers were randomly assigned to one of the four treatments. Success was assessed as clear or almost clear skin at the end of the 12 week period. The results of the study can be seen in the table below. Using the appropriate statistical test, determine if there is significant evidence that the four treatments perform differently. If so, how do they compare.arrow_forward
- A credit score is used by credit agencies (such as mortgage companies and banks) to assess the creditworthiness of individuals. Values range from 300 to 850, with a credit score over 700 considered to be a quality credit risk. According to a survey, the mean credit score is 702.4. A credit analyst wondered whether high-income individuals (incomes in excess of $100,000 per year) had higher credit scores. He obtained a random sample of 41 high-income individuals and found the sample mean credit score to be 721.3 with a standard deviation of 80.9. Conduct the appropriate test to determine if high-income individuals have higher credit scores at the a= 0.05 level of significance. State the null and alternative hypotheses. Ho H H₁ H (Type integers or decimals. Do not round.) Identify the t-statistic. to = (Round to two decimal places as needed.) Identify the P-value. P-value= (Round to three decimal places as needed.) Make a conclusion regarding the hypothesis. the null hypothesis. There…arrow_forwardA software company is interested in improving customer satisfaction rate from the 60% currently claimed. The company sponsored a survey of 148 customers and found that 95 customers were satisfied. What is the test statistic z?arrow_forwardA credit score is used by credit agencies (such as mortgage companies and banks) to assess the creditworthiness of individuals. Values range from 300 to 850, with a credit score over 700 considered to be a quality credit risk. According to a survey, the mean credit score is 710.6. A credit analyst wondered whether high-income individuals (incomes in excess of $100,000 per year) had higher credit scores. He obtained a random sample of 48 high-income individuals and found the sample mean credit score to be 723.6 with a standard deviation of 81.2. Conduct the appropriate test to determine if high-income individuals have higher credit scores at the a = 0.10 level of significance. Click the icon to view the table of critical t-values. State the null and alternative hypotheses. Fill in the correct answers below. Ho: Hyi H (Type integers or decimals. Do not round.) Identify the t-statistic. to = (Round to two decimal places as needed.) Approximate the P-value. The P-value is in the range Make…arrow_forward
- A credit score is used by credit agencies (such as mortgage companies and banks) to assess the creditworthiness of individuals. Values range from 300 to 850, with a credit score over 700 considered to be a quality credit risk. According to a survey, the mean credit score is 704.9. A credit analyst wondered whether high-income individuals (incomes in excess of $100,000 per year) had higher credit scores. He obtained a random sample of 33 high-income individuals and found the sample mean credit score to be 717.9 with a standard deviation of 83.9. Conduct the appropriate test to determine if high-income individuals have higher credit scores at the g = 0.05 level of significance. State the null and alternative hypotheses. Ho: µ 704.9 H1: µ > 704.9 (Type integers or decimals. Do not round.) Identify the t-statistic, to = (Round to two decimal places as needed.)arrow_forwardA credit score is used by credit agencies (such as mortgage companies and banks) to assess the creditworthiness of individuals. Values range from 300 to 850, with a credit score over 700 considered to be a quality credit risk. According to a survey, the mean credit score is 708.5. A credit analyst wondered whether high-income individuals (incomes in excess of $100,000 per year) had higher credit scores. He obtained a random sample of 43 high-income individuals and found the sample mean credit score to be 723.3 with a standard deviation of 84.6. Conduct the appropriate test to determine if high-income individuals have higher credit scores at the a = 0.05 level of significance. State the null and alternative hypotheses. Ho: H (Type integers or decimals. Do not round.) Identify the t-statistic. to = (Round to two decimal places as needed.) Identify the P-value. P-value = (Round to three decimal places as needed.) Make a conclusion regarding the hypothesis. the null hypothesis. There…arrow_forwardA software company is interested in improving customer satisfaction rate from the 65% currently claimed. The company sponsored a survey of 248 customers and found that 170 customers were satisfied. What is the test statistic z?arrow_forward
- A company claims that less than 30% of people who both work and live in Newcastle. A study revealed that among a random sample of 200 people working in Newcastle, 62 also lived in Newcastle. Does the sample support the company’s claim? Use a level of significance of 0.01.arrow_forwardA statistician changes her level of significance from .001 to .05. What impact will this change have on her risk of making a Type I and Type II error? Is the change in the level of significance a good decision? Why or why not?arrow_forwardstudy is designed to investigate whether there is a difference in response to various treatments in patients with rheumatoid arthritis. The outcome is patient's self-reported effect of treatment. The data are shown on the next page. Is there a significant difference in effect of treatment? Hint: Are severity of symptoms and treatment independent? Run the test at a 5% level of significance. Demonstrate the five steps for hypothesis testing and draw a conclusion based on your results. Remember to determine the p- value, if relevant. No Effect Symptoms Total Symptoms Worsened Improved Treatment 1 22 14 14 50 Treatment 2 14 15 21 50 Treatment 3 9 12 29 50arrow_forward
arrow_back_ios
arrow_forward_ios
Recommended textbooks for you
 MATLAB: An Introduction with ApplicationsStatisticsISBN:9781119256830Author:Amos GilatPublisher:John Wiley & Sons Inc
 Probability and Statistics for Engineering and th...StatisticsISBN:9781305251809Author:Jay L. DevorePublisher:Cengage Learning
 Statistics for The Behavioral Sciences (MindTap C...StatisticsISBN:9781305504912Author:Frederick J Gravetter, Larry B. WallnauPublisher:Cengage Learning
 Elementary Statistics: Picturing the World (7th E...StatisticsISBN:9780134683416Author:Ron Larson, Betsy FarberPublisher:PEARSON
 The Basic Practice of StatisticsStatisticsISBN:9781319042578Author:David S. Moore, William I. Notz, Michael A. FlignerPublisher:W. H. Freeman
 Introduction to the Practice of StatisticsStatisticsISBN:9781319013387Author:David S. Moore, George P. McCabe, Bruce A. CraigPublisher:W. H. Freeman

MATLAB: An Introduction with Applications
Statistics
ISBN:9781119256830
Author:Amos Gilat
Publisher:John Wiley & Sons Inc

Probability and Statistics for Engineering and th...
Statistics
ISBN:9781305251809
Author:Jay L. Devore
Publisher:Cengage Learning

Statistics for The Behavioral Sciences (MindTap C...
Statistics
ISBN:9781305504912
Author:Frederick J Gravetter, Larry B. Wallnau
Publisher:Cengage Learning

Elementary Statistics: Picturing the World (7th E...
Statistics
ISBN:9780134683416
Author:Ron Larson, Betsy Farber
Publisher:PEARSON

The Basic Practice of Statistics
Statistics
ISBN:9781319042578
Author:David S. Moore, William I. Notz, Michael A. Fligner
Publisher:W. H. Freeman

Introduction to the Practice of Statistics
Statistics
ISBN:9781319013387
Author:David S. Moore, George P. McCabe, Bruce A. Craig
Publisher:W. H. Freeman