
MATLAB: An Introduction with Applications
6th Edition
ISBN: 9781119256830
Author: Amos Gilat
Publisher: John Wiley & Sons Inc
expand_more
expand_more
format_list_bulleted
Related questions
Question
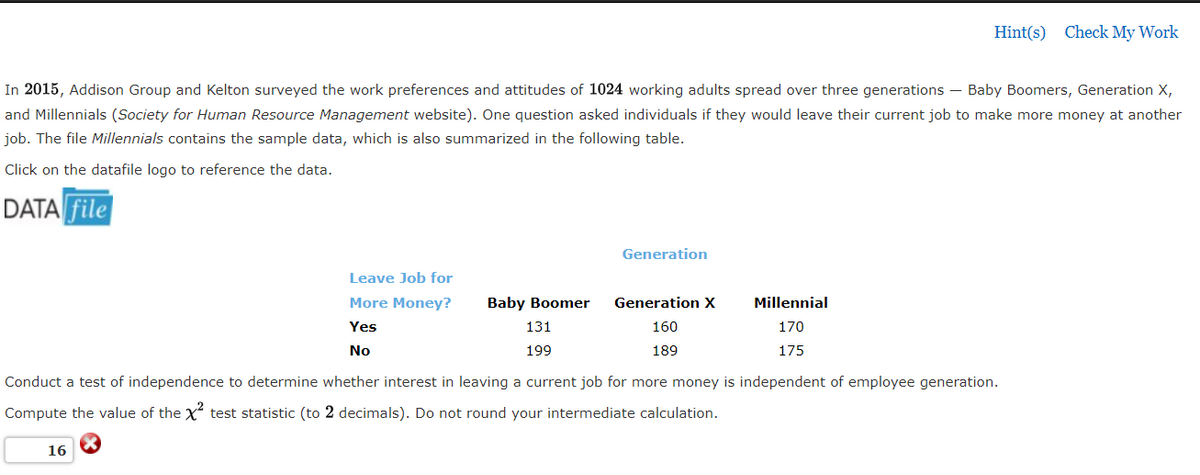

Transcribed Image Text:Hint(s) Check My Work
In 2015, Addison Group and Kelton surveyed the work preferences and attitudes of 1024 working adults spread over three generations – Baby Boomers, Generation X,
and Millennials (Society for Human Resource Management website). One question asked individuals if they would leave their current job to make more money at another
job. The file Millennials contains the sample data, which is also summarized in the following table.
Click on the datafile logo to reference the data.
DATA file
Generation
Leave Job for
More Money?
Baby Boomer
Generation x
Millennial
Yes
131
160
170
No
199
189
175
Conduct a test of independence to determine whether interest in leaving a current job for more money is independent of employee generation.
Compute the value of the X test statistic (to 2 decimals). Do not round your intermediate calculation.
16
Expert Solution
This question has been solved!
Explore an expertly crafted, step-by-step solution for a thorough understanding of key concepts.

This is a popular solution

Trending nowThis is a popular solution!

Step by stepSolved in 4 steps

Knowledge Booster

Similar questions
- You are an education researcher interested in studying if race or ethnicity affects the severity of punishment children receive. Through open records, you are able to collect from several high schools the length of suspensions given to kids for fighting along with the race/ethnicity of the child. The state of Texas divides school children into one of 7 race/ethnicity groups: African American, American Indian, Asian, Hispanic, Pacific Islander, White, or Multiracial. You want to compare the average length of suspension among these 7 groups. Which statistical test would be best to determine if there is a significant difference in the severity of punishment among the different groups? one-sample t-test related samples t-test independent samples t-test ANOVAarrow_forwardFind the mean, median and mode of the given sample. How would the mean, and median change if the highest salar is omitted? $250,00, $300,000, $350147, $232,425, $360,000, $1,231,421, $810,000, $229,000arrow_forwardWhen you hear thw words “population” and “sample,” what comes first in your mind?arrow_forward
- Construct a typology of pro-life attitudesarrow_forwardWhat terms are associated with the smallest and largest values of a data set? O smallest: minimum; largest: maximum O smallest: maximum; largest: minimum O smallest: middle; largest: maximum O smallest: minimum; largest: middlearrow_forwardA statistical program is recommended. The Condé Nast Traveler Gold List provides ratings for the top 20 small cruise ships. The data shown below are the scores each ship received based upon the results from Condé Nast Traveler's Annual Readers' Choice Survey. Each score represents the percentage of respondents who rated a ship as excellent or very good on several criteria, including Shore Excursions and Food/Dining. An overall score was also reported and used to rank the ships. The highest ranked ship, the Seabourn Odyssey, has an overall score of 94.4, the highest component of which is 97.8 for Food/Dining. Shore Ship Overall Food/Dining Excursions Seabourn Odyssey 94.4 90.9 97.8 Seabourn Pride 93.0 84.2 96.7 National Geographic Endeavor 92.9 100.0 88.5 Seabourn Sojourn 91.3 94.8 97.1 Paul Gauguin 90.5 87.9 91.2 Seabourn Legend 90.3 82.1 98.8 Seabourn Spirit 90.2 86.3 92.0 Silver Explorer 89.9 92.6 88.9 Silver Spirit 89.4 85.9 90.8 Seven Seas Navigator 89.2 83.3 90.5 Silver Whisperer…arrow_forward
- The following table gives the2009 estimates of crude oil reserves(in billionsof barrels).. Please answer step by step.Don,t skip any part. ANswer follow image.Answer must be correct.Do all calculation and classifyarrow_forwardIdentify an important reason for grouping data.arrow_forwardCan you do a histogram for Class 0-0.19, 0.20-0.39, 0.40-0.59, 0.60-0.79,0.80-0.99, 1.00-1.19, 1.20-1.39, Frequencies 25, 13, 5, 2, 2, 2, 3.arrow_forward
- How to identify Mode, median, and mean in positively and negatively skeweddistributions?arrow_forwardA large group of workers is divided into three departments: those who work in special operations, those who work on the main floor, and those who work in management. Strep throat has been going around and a health inspector would like to know if there is a relationship between department and having strep throat. She selects a random sample of 100 workers and classifies each one according to their department and whether they have strep throat. The data are displayed in the table. The health inspector would like to know if these data provide convincing evidence that the distribution of strep throat status differs across the departments in the population of all workers of this large company. What is the appropriate inference procedure? chi-square test for goodness of fit because the data come from one random sample chi-square test for homogeneity because the data come from independent random samples chi-square test for association/independence because the data come from one random…arrow_forwardVirginia polled a large sample of individuals to find the percentage of students with known food allergies and the percentage of students without known food allergies. Which of the following could sufficiently display the data if only the two given categories are to be included? Select the correct answer below: bar graph pie chart either a pie chart or a bar graph neither a pie chart nor a bar grapharrow_forward
arrow_back_ios
SEE MORE QUESTIONS
arrow_forward_ios
Recommended textbooks for you
- MATLAB: An Introduction with ApplicationsStatisticsISBN:9781119256830Author:Amos GilatPublisher:John Wiley & Sons Inc
 Probability and Statistics for Engineering and th...StatisticsISBN:9781305251809Author:Jay L. DevorePublisher:Cengage Learning
 Statistics for The Behavioral Sciences (MindTap C...StatisticsISBN:9781305504912Author:Frederick J Gravetter, Larry B. WallnauPublisher:Cengage Learning
  Elementary Statistics: Picturing the World (7th E...StatisticsISBN:9780134683416Author:Ron Larson, Betsy FarberPublisher:PEARSON
 The Basic Practice of StatisticsStatisticsISBN:9781319042578Author:David S. Moore, William I. Notz, Michael A. FlignerPublisher:W. H. Freeman
 Introduction to the Practice of StatisticsStatisticsISBN:9781319013387Author:David S. Moore, George P. McCabe, Bruce A. CraigPublisher:W. H. Freeman
MATLAB: An Introduction with Applications
Statistics
ISBN:9781119256830
Author:Amos Gilat
Publisher:John Wiley & Sons Inc
Probability and Statistics for Engineering and th...
Statistics
ISBN:9781305251809
Author:Jay L. Devore
Publisher:Cengage Learning
Statistics for The Behavioral Sciences (MindTap C...
Statistics
ISBN:9781305504912
Author:Frederick J Gravetter, Larry B. Wallnau
Publisher:Cengage Learning
Elementary Statistics: Picturing the World (7th E...
Statistics
ISBN:9780134683416
Author:Ron Larson, Betsy Farber
Publisher:PEARSON
The Basic Practice of Statistics
Statistics
ISBN:9781319042578
Author:David S. Moore, William I. Notz, Michael A. Fligner
Publisher:W. H. Freeman
Introduction to the Practice of Statistics
Statistics
ISBN:9781319013387
Author:David S. Moore, George P. McCabe, Bruce A. Craig
Publisher:W. H. Freeman