Question

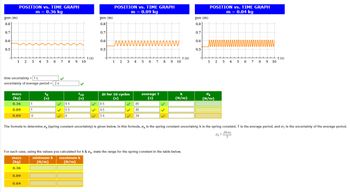
Transcribed Image Text:pos (m)
0.8
0.7
0.6
0.5
POSITION vs. TIME GRAPH
m = 0.36 kg
POSITION vs. TIME GRAPH
m = 0.09 kg
pos (m)
0.8
0.7
wwwwww
0.6
0.5
t(s)
1 2
3
4 5 6 7 8 9
10
pos (m)
0.8
0.7
0.6
www
0.5
t(s)
1 2 3
4 5 6
7
8
9
10
time uncertainty -1s
uncertainty of average period = 2 s
POSITION vs. TIME GRAPH
m = 0.04 kg
wwwwwwwwwwwww
t(s)
1 2 3 4 5 6 7 8 9 10
mass
(kg)
0.36
0.09
0.04
(s)
1
1
6
9.5
5.5
4
t10
(s)
At for 10 cycles
(s)
8.5
4.5
3.4
.85
.45
.34
average T
(5)
k
(N/m)
σκ
(N/m)
The formula to determine σ (spring constant uncertainty) is given below. In this formula, σk is the spring constant uncertainty, k is the spring constant, T is the average period, and σ is the uncertainty of the average period.
2KOT
For each case, using the values you calculated for k & σk, state the range for the spring constant in the table below.
mass
(kg)
0.36
0.09
0.04
minimum k
(N/m)
maximum k
(N/m)
T
Expert Solution
This question has been solved!
Explore an expertly crafted, step-by-step solution for a thorough understanding of key concepts.
Step by stepSolved in 3 steps with 1 images

Knowledge Booster
Similar questions
- If you have a simple pendulum where the equation of its linear graph is : L = g(T/2pi)2 where x = (T/2pi)2 and Y = L (where L is the length of the pendulum in m) and b=0. How will you calculate the uncertainty of X and Y? ??= ? ??= ?arrow_forwardReport your answer to two decimal placesarrow_forwardWhat is the uncertainty in the temperature difference, ΔT, between the two temperature T1 = (25.0 ± 0.5) oC and T2 = (30.0 ± 0.3) oC?arrow_forward
- Find the uncertainty in the moment of interia. Moment of interia of a disk depends on mass and radius accordng to this function I(m,r) = 1/2 m r. Your measured mass and radius have the following uncertainties Sm = 0.34 kg and Sr = 0.17 m. What is is the uncertainty in moment of interia, %3D S1 , if the measured mass, m 6.05 kg and the measured radius, r = 14.74 m? Units are not neededarrow_forwardTwo decimals places for physicsarrow_forwardFind the uncertainty in kinetic energy. Kinetic energy depends on mass and velocity according to this function E(m,v) = 1/2 m v2. Your measured mass and velocity have the following uncertainties Sm = 0.38 kg and Sv = 0.1 m/s. What is is the uncertainty in energy, SE , if the measured mass, m = 3.1 kg and the measured velocity, v = -7.52 m/s? Units are not needed in your answer.arrow_forward
- Finx the spring constant Ks from the slope' of the M (grams) vs X (cm) plot, using Ks= S' g equation. Determine Delta Ks using uncertainty Delta S' in the slope of the M (grams) vs X (cm) plot. Slope'= 26.00 Error on slope, Delta Slope'= +/- 1.036arrow_forward1. Use the data of three trials with the launcher in a horizontal position to determine average, standard deviation and uncertainty of both time and range. Table 1: Trial Time t_(s) Range Ax_(m) 1 0.2049 0.963 0.2114 0.972 3. 0.2083 1.009 Average 0.2082 0.981 Standard deviation Uncertainty Check: Measure the height of ncher H with your ruler: H = 21.4 cm calculate the theoretical time of flight: Is the above value in good agreement with the average time from table 1? Explain. 2. Using the data in Table 1 calculate the initial speed vo= Axevezse/toveurs Initial speed Xe= (units:arrow_forwardFor questions (1) – (8) use the following information. You have measured the length of a table to be 205.0 cm, 205.8 cm, 205.4 cm, 204.6 cm, and 204.9 cm five independent times. You measured the width of the same table to be 60.1 cm, 60.4 cm, 60.2 cm, 60.0 cm, and 60.5 cm five independent times. 1) Calculate the mean length L of the table. 2) Calculate the standard deviation of the mean length σ of the table. 3) Calculate the mean width W of the table. 4) Calculate the standard deviation of the mean width ow of the table. 5) Calculate the area A = L x W of the table. 6) Using the correct equation for propagation of error, calculate the uncertainty of the area OA of the table.arrow_forward
arrow_back_ios
SEE MORE QUESTIONS
arrow_forward_ios