Advanced Engineering Mathematics
10th Edition
ISBN: 9780470458365
Author: Erwin Kreyszig
Publisher: Wiley, John & Sons, Incorporated
expand_more
expand_more
format_list_bulleted
Question

Transcribed Image Text:IJ
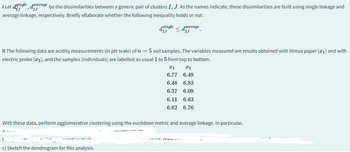
I Let dingle, daverage be the dissimilarities between a generic pair of clusters I, J. As the names indicate, these dissimilarities are built using single linkage and
average linkage, respectively. Briefly ellaborate whether the following inequality holds or not:
dsingle
IJ
Javerage
IJ
II The following data are acidity measurements (in pH scale) of n = 5 soil samples. The variables measured are results obtained with litmus paper (1) and with
electric probe (x2), and the samples (individuals) are labelled as usual 1 to 5 from top to bottom.
Ꮖ 1
x2
6.77 6.49
6.48 6.83
6.37 6.09
6.11 6.63
6.62 6.76
With these data, perform agglomerative clustering using the euclidean metric and average linkage. In particular,
c) Sketch the dendrogram for this analysis.
wing state
Expert Solution
This question has been solved!
Explore an expertly crafted, step-by-step solution for a thorough understanding of key concepts.
Step by stepSolved in 2 steps

Knowledge Booster
Similar questions
- I need help calculating the population size (n), sum, mean, median, mode, range, std. deviation and coef. of variation.arrow_forwardthis only shows a but a b and carrow_forwardA student has taken 4 area exams designed to measure particular intellectual abilities. The following table identifies each test, summarizes its characteristics, and provides the student’s score on it. Assume that the possible scores on each test are normally distributed. Area Test ? ? Student’s Score Verbal Ability 58.50 6.50 63.00 Visualization 110.00 15.00 102.50 Memory 85.00 11.50 98.00 Spatial Relations 320.00 33.50 343.00 a. Change each student’s score to its z-score equivalent b. On which test did the student score in the highest position? c. On which test did the student score in the lowest position? d. What is the percentile rank of the student’s Verbal Ability? e. What percentage of the students who took the Spatial Relations test scored higher than the student? f. Between what two scores on Memory did the middle 95% of students lie? g. What percent of students had scores between X = 95 and X = 110 on Visualization?arrow_forward
- The following table shows the typical depth (rounded to the nearest foot) for nonfailed wells in geological formations in Baltimore County (The Journal of Data Science, 2009, Vol. 7, pp. 111-127). Geological Formation Group Number of Nonfailed Wells Nonfailed Well Depth Gneiss 1,515 255 Granite 26 218 Loch Raven Schist 3,290 317 Mafic 349 231 Marble 280 267 Prettyboy Schist 1,343 255 Other schists 887 267 Serpentine 36 217 Total 7,726 2,027 Let the random variable X denote the depth (rounded to the nearest foot) for nonfailed wells. Detemine the cumulative distribution function for X. Round your answers to four decimal places (e.g. 98.7654). x < 217 217arrow_forward15. Diameter of Douglas Fir Trees The diameter of the Douglas fir tree is measured at a height of 1.37 meters. The S following data represent the diameter in centimeters of a random sample of 12 Douglas firs in the western Washington Cascades. 156 162 147 173 147 190 130 101 159 113 181 109 Source: L. Winter. "Live Tree and Tree-Ring Records to Reconstruct the Structural Development of an Old-Growth Douglas Fir/Western Hemlock Stand in the Western Washington Cascades." Corvallis, OR: Forest Science Data Bank, 2005. (a) Obtain a point estimate for the mean and standard deviation diameter of a Douglas fir tree in the western Washington Cascades. (b) Because the sample size is small, we must verify that the data come from a population that is normally distributed and that the data do not contain any outliers. The figures show the normal probability plot and boxplot. The correlation between the tree diameters and expected z-scores is 0.982. Use Option 1 or Option 2 to determine if the…arrow_forwardA random sample of 20 adults in a particular country were asked to state what type of birth control method they use. The results are in the table below. None None None Condom Condom Condom Pill Pill Other Other Pill Other Condom Condom Pill None Condom Pill Pill Other a) Since data were collected for variable(s), the correct graph to make is a . b) Complete the frequency/relative frequency table. Birth Control Type Frequency Relative Frequency None Condom Pill Other c) Which of the following is the correct bar chart for the given data? 2468Birth Control TypeFreqNoneCondomPillOther[Graphs generated by this script: setBorder(49,45,0,10); initPicture(0,13,0,8);axes(1000,2,1,1000,2); fill="blue"; textabs([165,0],"Birth Control…arrow_forwardStem Leaf 214 26 31334 36 6 677 9 412 45 Using the data set above, determine if there are any outliers. If there are no outliers, enter DNE.arrow_forwardPlease see the graph below to answer this question. Need help. How would you describe the distribution of sunglasses? (hint: 3 part answer) options: unimodal uniform bimodal has more than 2 humps or modes approximately symmetric skewed to the left skewed to the rightarrow_forwarda. has a drop down box of fail or reject b. first drop box is less or greater, second drop down is fail or reject. c. first drop box is less or greater, second drop down is fail or reject. The question is attached,arrow_forwardarrow_back_iosarrow_forward_ios
Recommended textbooks for you
 Advanced Engineering MathematicsAdvanced MathISBN:9780470458365Author:Erwin KreyszigPublisher:Wiley, John & Sons, Incorporated
 Numerical Methods for EngineersAdvanced MathISBN:9780073397924Author:Steven C. Chapra Dr., Raymond P. CanalePublisher:McGraw-Hill Education
 Introductory Mathematics for Engineering Applicat...Advanced MathISBN:9781118141809Author:Nathan KlingbeilPublisher:WILEY
 Mathematics For Machine TechnologyAdvanced MathISBN:9781337798310Author:Peterson, John.Publisher:Cengage Learning,


Advanced Engineering Mathematics
Advanced Math
ISBN:9780470458365
Author:Erwin Kreyszig
Publisher:Wiley, John & Sons, Incorporated

Numerical Methods for Engineers
Advanced Math
ISBN:9780073397924
Author:Steven C. Chapra Dr., Raymond P. Canale
Publisher:McGraw-Hill Education

Introductory Mathematics for Engineering Applicat...
Advanced Math
ISBN:9781118141809
Author:Nathan Klingbeil
Publisher:WILEY

Mathematics For Machine Technology
Advanced Math
ISBN:9781337798310
Author:Peterson, John.
Publisher:Cengage Learning,

