
MATLAB: An Introduction with Applications
6th Edition
ISBN: 9781119256830
Author: Amos Gilat
Publisher: John Wiley & Sons Inc
expand_more
expand_more
format_list_bulleted
Related questions
Topic Video
Question
ans. only number 1
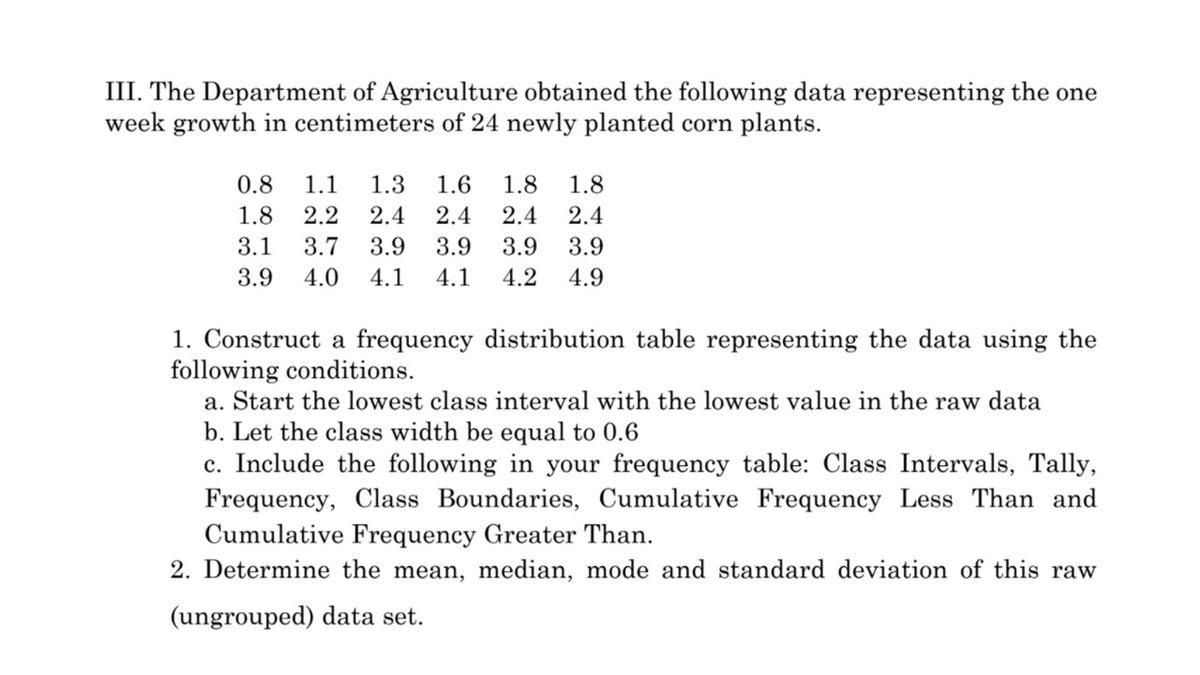

Transcribed Image Text:III. The Department of Agriculture obtained the following data representing the one
week growth in centimeters of 24 newly planted corn plants.
0.8
1.1
1.3
1.6
1.8
1.8
1.8
2.2
2.4
2.4
2.4
2.4
3.1
3.7
3.9
3.9
3.9
3.9
3.9
4.0
4.1
4.1
4.2
4.9
1. Construct a frequency distribution table representing the data using the
following conditions.
a. Start the lowest class interval with the lowest value in the raw data
b. Let the class width be
ual to 0.6
c. Include the following in your frequency table: Class Intervals, Tally,
Frequency, Class Boundaries, Cumulative Frequency Less Than and
Cumulative Frequency Greater Than.
2. Determine the mean, median, mode and standard deviation of this raw
(ungrouped) data set.
Expert Solution
This question has been solved!
Explore an expertly crafted, step-by-step solution for a thorough understanding of key concepts.

This is a popular solution

Trending nowThis is a popular solution!

Step by stepSolved in 2 steps with 1 images

Knowledge Booster


Learn more about
Need a deep-dive on the concept behind this application? Look no further. Learn more about this topic, statistics and related others by exploring similar questions and additional content below.Similar questions
- Solve. 2x2 - 7x - 15 = 0 O A. z = = x = -5 2' O B. æ = T = 5 2' 3 I = 5 2' C. x = 3 r = -5 2' O D. x = - 3.arrow_forward1. Simplify 72.7³ O A. 75 OB. 7⁰ OC. 495 O D. 496 2. Simplify w ¹w105. OA. 2w80 20 OB. 2w¹829 OC. W80x20 OD. ¹89arrow_forwardThe jug of fruit juice contains ( The label on a 3-gallon jug of fruit juice states that the serving size is 8 oz. How many servings are in the jug? servings. Question 14, 6.3.arrow_forward
arrow_back_ios
arrow_forward_ios
Recommended textbooks for you
- MATLAB: An Introduction with ApplicationsStatisticsISBN:9781119256830Author:Amos GilatPublisher:John Wiley & Sons Inc
 Probability and Statistics for Engineering and th...StatisticsISBN:9781305251809Author:Jay L. DevorePublisher:Cengage Learning
 Statistics for The Behavioral Sciences (MindTap C...StatisticsISBN:9781305504912Author:Frederick J Gravetter, Larry B. WallnauPublisher:Cengage Learning
  Elementary Statistics: Picturing the World (7th E...StatisticsISBN:9780134683416Author:Ron Larson, Betsy FarberPublisher:PEARSON
 The Basic Practice of StatisticsStatisticsISBN:9781319042578Author:David S. Moore, William I. Notz, Michael A. FlignerPublisher:W. H. Freeman
 Introduction to the Practice of StatisticsStatisticsISBN:9781319013387Author:David S. Moore, George P. McCabe, Bruce A. CraigPublisher:W. H. Freeman
MATLAB: An Introduction with Applications
Statistics
ISBN:9781119256830
Author:Amos Gilat
Publisher:John Wiley & Sons Inc
Probability and Statistics for Engineering and th...
Statistics
ISBN:9781305251809
Author:Jay L. Devore
Publisher:Cengage Learning
Statistics for The Behavioral Sciences (MindTap C...
Statistics
ISBN:9781305504912
Author:Frederick J Gravetter, Larry B. Wallnau
Publisher:Cengage Learning
Elementary Statistics: Picturing the World (7th E...
Statistics
ISBN:9780134683416
Author:Ron Larson, Betsy Farber
Publisher:PEARSON
The Basic Practice of Statistics
Statistics
ISBN:9781319042578
Author:David S. Moore, William I. Notz, Michael A. Fligner
Publisher:W. H. Freeman
Introduction to the Practice of Statistics
Statistics
ISBN:9781319013387
Author:David S. Moore, George P. McCabe, Bruce A. Craig
Publisher:W. H. Freeman