MATLAB: An Introduction with Applications
6th Edition
ISBN: 9781119256830
Author: Amos Gilat
Publisher: John Wiley & Sons Inc
expand_more
expand_more
format_list_bulleted
Concept explainers
Topic Video
Question
last two

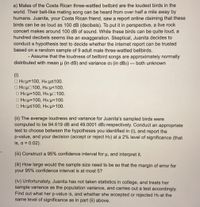
Transcribed Image Text:### Hypothesis Testing of Costa Rican Three-wattled Bellbird Loudness
**Context:**
Males of the Costa Rican three-wattled bellbird are considered the loudest birds globally. Their call, reaching an audience over half a mile away, is claimed to reach 100 dB (decibels), comparable to a live rock concert. Juanita, skeptical of such claims, aims to verify this through statistical analysis using a sample of 9 bellbirds.
**Assumptions:**
- The loudness of bellbird songs is approximately normally distributed with mean μ (in dB) and unknown variance σ² (in dB²).
**Tasks:**
1. **Hypotheses Formulation (i):**
Juanita needs to select the appropriate null (H₀) and alternative hypotheses (Hₐ) from the following options:
- H₀: μ = 100, Hₐ: μ ≠ 100
- H₀: μ = 100, Hₐ: μ < 100
- H₀: μ = 100, Hₐ: μ > 100
2. **Conducting the Test (ii):**
- Sample results: Average loudness = 94.619 dB, Variance = 49.0001 dB².
- Conduct a hypothesis test to choose between the hypotheses, reporting the p-value and decision at a 2% significance level (α = 0.02).
3. **95% Confidence Interval (iii):**
- Construct a 95% confidence interval for μ and provide an interpretation.
4. **Sample Size Calculation (iii, second part):**
- Determine necessary sample size for a margin of error not exceeding 5 dB within the 95% confidence interval.
5. **P-value Interpretation (iv):**
- Despite lacking statistical training, Juanita adopts population variance as sample variance. Determine her p-value and decide whether she accepts or rejects H₀ at the established significance level (2%).
This educational exercise demonstrates hypothesis testing and statistical interpretation through analyzing the bellbird's loudness claims.
Expert Solution
arrow_forward
Step 1
Given: Sample size, n = 9
Sample mean, m = 94.619
SAmple variance, s2 = 49.0001
Part (iv): Since the population variance is unknown, the margin of error "E" to be at most 5 implies
Step by stepSolved in 2 steps

Knowledge Booster
Learn more about
Need a deep-dive on the concept behind this application? Look no further. Learn more about this topic, statistics and related others by exploring similar questions and additional content below.Similar questions
Recommended textbooks for you
 MATLAB: An Introduction with ApplicationsStatisticsISBN:9781119256830Author:Amos GilatPublisher:John Wiley & Sons Inc
 Probability and Statistics for Engineering and th...StatisticsISBN:9781305251809Author:Jay L. DevorePublisher:Cengage Learning
 Statistics for The Behavioral Sciences (MindTap C...StatisticsISBN:9781305504912Author:Frederick J Gravetter, Larry B. WallnauPublisher:Cengage Learning
 Elementary Statistics: Picturing the World (7th E...StatisticsISBN:9780134683416Author:Ron Larson, Betsy FarberPublisher:PEARSON
 The Basic Practice of StatisticsStatisticsISBN:9781319042578Author:David S. Moore, William I. Notz, Michael A. FlignerPublisher:W. H. Freeman
 Introduction to the Practice of StatisticsStatisticsISBN:9781319013387Author:David S. Moore, George P. McCabe, Bruce A. CraigPublisher:W. H. Freeman

MATLAB: An Introduction with Applications
Statistics
ISBN:9781119256830
Author:Amos Gilat
Publisher:John Wiley & Sons Inc

Probability and Statistics for Engineering and th...
Statistics
ISBN:9781305251809
Author:Jay L. Devore
Publisher:Cengage Learning

Statistics for The Behavioral Sciences (MindTap C...
Statistics
ISBN:9781305504912
Author:Frederick J Gravetter, Larry B. Wallnau
Publisher:Cengage Learning

Elementary Statistics: Picturing the World (7th E...
Statistics
ISBN:9780134683416
Author:Ron Larson, Betsy Farber
Publisher:PEARSON

The Basic Practice of Statistics
Statistics
ISBN:9781319042578
Author:David S. Moore, William I. Notz, Michael A. Fligner
Publisher:W. H. Freeman

Introduction to the Practice of Statistics
Statistics
ISBN:9781319013387
Author:David S. Moore, George P. McCabe, Bruce A. Craig
Publisher:W. H. Freeman