
MATLAB: An Introduction with Applications
6th Edition
ISBN: 9781119256830
Author: Amos Gilat
Publisher: John Wiley & Sons Inc
expand_more
expand_more
format_list_bulleted
Related questions
Question
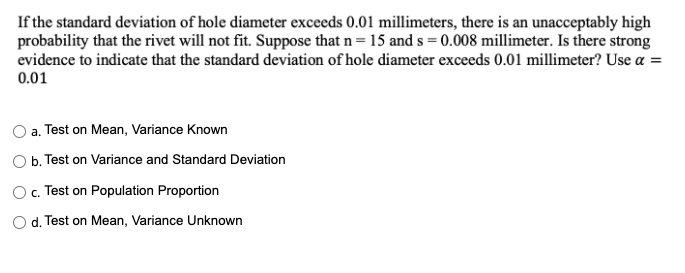

Transcribed Image Text:If the standard deviation of hole diameter exceeds 0.01 millimeters, there is an unacceptably high
probability that the rivet will not fit. Suppose that n= 15 and s = 0.008 millimeter. Is there strong
evidence to indicate that the standard deviation of hole diameter exceeds 0.01 millimeter? Use a =
0.01
a. Test on Mean, Variance Known
b. Test on Variance and Standard Deviation
O. Test on Population Proportion
O d. Test on Mean, Variance Unknown
Expert Solution
This question has been solved!
Explore an expertly crafted, step-by-step solution for a thorough understanding of key concepts.

Step by stepSolved in 2 steps

Knowledge Booster

Similar questions
- See the attached image for the introduction. Based on the JMP outputs and plots above, make comments on the appropriateness of assumptions for the one-way ANOVA model. • Constant variance: • Normality:arrow_forwardUse Table A to find the value of a standard Normal variable that satisfies each of the given conditions. (Use the value of z from Table A that comes closest to satisfying the condition.) In each case, sketch a standard Normal curve with your value of z marked on the axis, bo Find the point with 75% of the observations falling below it. Give your answer to two decimal places. z =arrow_forwardCan I have two positive numbers with a normal standard distribution? I'm stuck. Please help. Thank you.arrow_forward
- Use Table A to find the value z of a standard Normal variable that satisfies each of the given conditions. (Use the value of z from Table A that comes closest to satisfying the condition.) In each case, sketch a standard Normal curve with your value of z marked on the axis. Find the point z with 14% of the observations falling below it. Give your answer to two decimal places.arrow_forwardSuppose that the sitting back-to-knee length for a group of adults has a normal distribution with a mean of u-23.3 in. and a standard deviation of a 1.2 in. These data are often used in the design of different seats, including aircraft seats, train seats, theater seats, and classroom seats. Instead of using 0.05 for identifying significant values, use the criteria that a value x is significantly high Pix or greater) s0.01 and a value is significantly low if P(x or less) 50.01. Find the back-to-knee lengths separating significant values from those that are not significant. Using these criteria, is a back-to-knee length of 25.4 in. significantly high? Find the back-to-knee lengths separating significant values from those that are not significant Back-to-knee lengths greater than in and less than in are not significant, and values outside that range are considered significant (Round to one decimal place as needed.)arrow_forwardPv. Don't provide handwriting solutionarrow_forward
- PLEASE SHOW WORK..arrow_forwardI am having difficulty with The Analysis of Biological Data chapter 10 question 15AP, I need to check my solutions but there are none posted for me to review. If I could compare answers that would be great.arrow_forwardA survey found that women's heights are normally distributed with mean 62.8 in. and standard deviation 2.2 in. The survey also found that men's heights are normally distributed with mean 69.5 in. and standard deviation 3.2 in. Most of the live characters employed at an amusement park have height requirements of a minimum of 56 in. and a maximum of 63 in. Complete parts (a) and (b) below. a. Find the percentage of men meeting the height requirement. What does the result suggest about the genders of the people who are employed as characters at the amusement park? The percentage of men who meet the height requirement is %. (Round to two decimal places as needed.)arrow_forward
- It is given that a vending machine dispenses a mean of 7.6 ounces with a standard deviation of 0.4 ounce. For the vending machine to overflow an 8-ounce cup, the machine must pour more than 8 − 7.6 = ounces greater than the mean. This amount is standard deviation(s) from the mean.arrow_forwardWhat is the formula for the standard error of the normal approximation to the p distribution. P=arrow_forwardA survey found that women's heights are normally distributed with mean 62.1 in. and standard deviation 3.3 in. The survey also found that men's heights are normally distributed with mean 67.9 in. and standard deviation 3.4 in. Most of the live characters employed at an amusement park have height requirements of a minimum of 55 in. and a maximum of 62in. Complete parts (a) and (b) below. a. Find the percentage of men meeting the height requirement. What does the result suggest about the genders of the people who are employed as characters at the amusement park? The percentage of men who meet the height requirement is nothing %.arrow_forward
arrow_back_ios
SEE MORE QUESTIONS
arrow_forward_ios
Recommended textbooks for you
- MATLAB: An Introduction with ApplicationsStatisticsISBN:9781119256830Author:Amos GilatPublisher:John Wiley & Sons Inc
 Probability and Statistics for Engineering and th...StatisticsISBN:9781305251809Author:Jay L. DevorePublisher:Cengage Learning
 Statistics for The Behavioral Sciences (MindTap C...StatisticsISBN:9781305504912Author:Frederick J Gravetter, Larry B. WallnauPublisher:Cengage Learning
  Elementary Statistics: Picturing the World (7th E...StatisticsISBN:9780134683416Author:Ron Larson, Betsy FarberPublisher:PEARSON
 The Basic Practice of StatisticsStatisticsISBN:9781319042578Author:David S. Moore, William I. Notz, Michael A. FlignerPublisher:W. H. Freeman
 Introduction to the Practice of StatisticsStatisticsISBN:9781319013387Author:David S. Moore, George P. McCabe, Bruce A. CraigPublisher:W. H. Freeman
MATLAB: An Introduction with Applications
Statistics
ISBN:9781119256830
Author:Amos Gilat
Publisher:John Wiley & Sons Inc
Probability and Statistics for Engineering and th...
Statistics
ISBN:9781305251809
Author:Jay L. Devore
Publisher:Cengage Learning
Statistics for The Behavioral Sciences (MindTap C...
Statistics
ISBN:9781305504912
Author:Frederick J Gravetter, Larry B. Wallnau
Publisher:Cengage Learning
Elementary Statistics: Picturing the World (7th E...
Statistics
ISBN:9780134683416
Author:Ron Larson, Betsy Farber
Publisher:PEARSON
The Basic Practice of Statistics
Statistics
ISBN:9781319042578
Author:David S. Moore, William I. Notz, Michael A. Fligner
Publisher:W. H. Freeman
Introduction to the Practice of Statistics
Statistics
ISBN:9781319013387
Author:David S. Moore, George P. McCabe, Bruce A. Craig
Publisher:W. H. Freeman