
MATLAB: An Introduction with Applications
6th Edition
ISBN: 9781119256830
Author: Amos Gilat
Publisher: John Wiley & Sons Inc
expand_more
expand_more
format_list_bulleted
Related questions
Concept explainers
Question
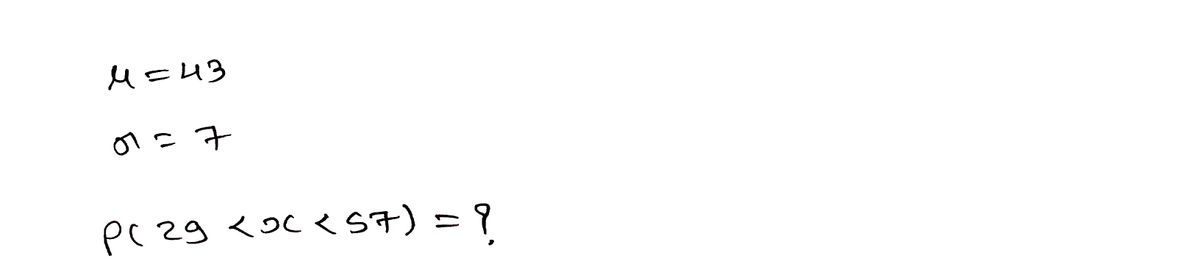
If the age distribution of customers at a major retail chain is thought to be bell-shaped with a mean equal to 43 years and a standard deviation equal to 7 years, the percentage of customers between the ages of 29 and 57 years is: (Hint: use the
A) approximately 68.
B) approximately 81.5.
C) approximately 95.
D) at least 75.
Expert Solution
arrow_forward
Step 1

Trending nowThis is a popular solution!

Step by stepSolved in 2 steps with 2 images

Knowledge Booster


Learn more about
Need a deep-dive on the concept behind this application? Look no further. Learn more about this topic, statistics and related others by exploring similar questions and additional content below.Similar questions
- Need help with this question. An image is provided.arrow_forwardThe graph illustrates the distribution of test scores. The mean score was 73 and the standard deviation was 9. 46 55 64 73 82 91 100 Distribution of Test Scores Use the "Empirical Rule", not a calculator or other technology. a. What is the approximate percentage students who scored between 64 and 82 on the test? b. What Is the approximate percentage of students who scored between 55 and 91 on the test? 96 C. What is the approximate percentage of students who scored less than 55 on the test? d. What is the approximate percentage of students who scored between 73 and 82 on the test?arrow_forwardFor a data set of the pulse rates for a sample of adult females, the lowest pulse rate is 38beats per minute, the mean of the listed pulse rates is x =73.0 beats per minute, and their standard deviation is sequals=23.2 beats per minute. a. What is the difference between the pulse rate of 38 beats per minute and the mean pulse rate of the females? b. How many standard deviations is that [the difference found in part (a)]? c. Convert the pulse rate of 38 beats per minutes to a z score. d. If we consider pulse rates that convert to z scores between minus−2 and 2 to be neither significantly low nor significantly high, is the pulse rate of 38 beats per minute significant?arrow_forward
- Fill in missing values in the following statements. The distribution of scores on the test written by a large group of students is skewed with the mean of 55 points and standard deviation of 5 points. Fill in missing values in the following statements. a. According to Tchebysheff's Theorem, at least 75% of scores will fall into the interval between points and points. b. At least c. At most d. At most percent of scores fall between 40 points and 70 points. percent of scores are smaller than 40 points or larger than 70 points. percent of scores are smaller than 40 points. bermarrow_forwardIf some data is symmetrical and unimodal, and the mean and standard deviation are 230 and 40 respectively: a)How much of the data lies between 190 and 270 b)How much lies between 150 and 230 c)How much lies between 190 and 310arrow_forwardthe driving distances (miles) to wor of 30 people are shown below. assume the population standard deviation is 8 miles. Find: 12, 9, 7, 3, 27, 21, 2, 30, 7, 4, 1, 10, 2, 9, 2, 28, 7, 10, 13, 6, 13, 7, 3, 13, 6, 6, 3, 13 ,12, 16, 18 a) the point estimate of the population mean b) the margin of error for a 95% confidence interval c) contruct a 95% confidence interval for the population mean.arrow_forward
- Consider the data from the Anthropology 105 class. The mean for women is 64.33 in and the standard deviation is 2.64 in. The average height of men in the US is approximately 5ft 10in. What proportion of women represented here are shorter than the average man?arrow_forwardDiastolic blood pressures are assumed to follow a normal distribution with a mean of 85 and a standard deviation of 12. What proportion of people has diastolic blood pressures less than 80? A)0.661 B)0.338 C)0.50 D)0.75arrow_forwardFor the normal distribution of adult males in North America (mean=70.0 inches, standard deviation=4.0 inches), find the proportion of those who are a) under 65 inches b) over 76 inches c) between 67 and 73 inchesarrow_forward
- 1. The mean age for licensed physicians in the United States is 51.5 years. A government officialrandomly selects 700 licensed physicians and computes their mean age to be 50.9 years.a. Which value is the parameter and which the statistic? b. Is it unreasonable that the mean of the 700 physicians is different than 51.5? Explain.arrow_forward14. The range is defined as the: a. variability of the data with reference to extreme scores. b. the variability of the data with reference to the mean. c. variability of the data in terms of how many subjects achieved each value of the variable. d. SS/narrow_forward9a. For binomially distributed data set, approximately what proportion would be below the mean and also within one standard deviation? 16.5%,25%,33%,50%,66%arrow_forward
arrow_back_ios
arrow_forward_ios
Recommended textbooks for you
- MATLAB: An Introduction with ApplicationsStatisticsISBN:9781119256830Author:Amos GilatPublisher:John Wiley & Sons Inc
 Probability and Statistics for Engineering and th...StatisticsISBN:9781305251809Author:Jay L. DevorePublisher:Cengage Learning
 Statistics for The Behavioral Sciences (MindTap C...StatisticsISBN:9781305504912Author:Frederick J Gravetter, Larry B. WallnauPublisher:Cengage Learning
  Elementary Statistics: Picturing the World (7th E...StatisticsISBN:9780134683416Author:Ron Larson, Betsy FarberPublisher:PEARSON
 The Basic Practice of StatisticsStatisticsISBN:9781319042578Author:David S. Moore, William I. Notz, Michael A. FlignerPublisher:W. H. Freeman
 Introduction to the Practice of StatisticsStatisticsISBN:9781319013387Author:David S. Moore, George P. McCabe, Bruce A. CraigPublisher:W. H. Freeman
MATLAB: An Introduction with Applications
Statistics
ISBN:9781119256830
Author:Amos Gilat
Publisher:John Wiley & Sons Inc
Probability and Statistics for Engineering and th...
Statistics
ISBN:9781305251809
Author:Jay L. Devore
Publisher:Cengage Learning
Statistics for The Behavioral Sciences (MindTap C...
Statistics
ISBN:9781305504912
Author:Frederick J Gravetter, Larry B. Wallnau
Publisher:Cengage Learning
Elementary Statistics: Picturing the World (7th E...
Statistics
ISBN:9780134683416
Author:Ron Larson, Betsy Farber
Publisher:PEARSON
The Basic Practice of Statistics
Statistics
ISBN:9781319042578
Author:David S. Moore, William I. Notz, Michael A. Fligner
Publisher:W. H. Freeman
Introduction to the Practice of Statistics
Statistics
ISBN:9781319013387
Author:David S. Moore, George P. McCabe, Bruce A. Craig
Publisher:W. H. Freeman