MATLAB: An Introduction with Applications
6th Edition
ISBN: 9781119256830
Author: Amos Gilat
Publisher: John Wiley & Sons Inc
expand_more
expand_more
format_list_bulleted
Question

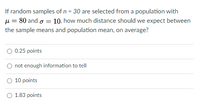
Transcribed Image Text:If random samples of n = 30 are selected from a population with
µ = 80 and o = 10, how much distance should we expect between
the sample means and population mean, on average?
0.25 points
not enough information to tell
10 points
1.83 points
Expert Solution
arrow_forward
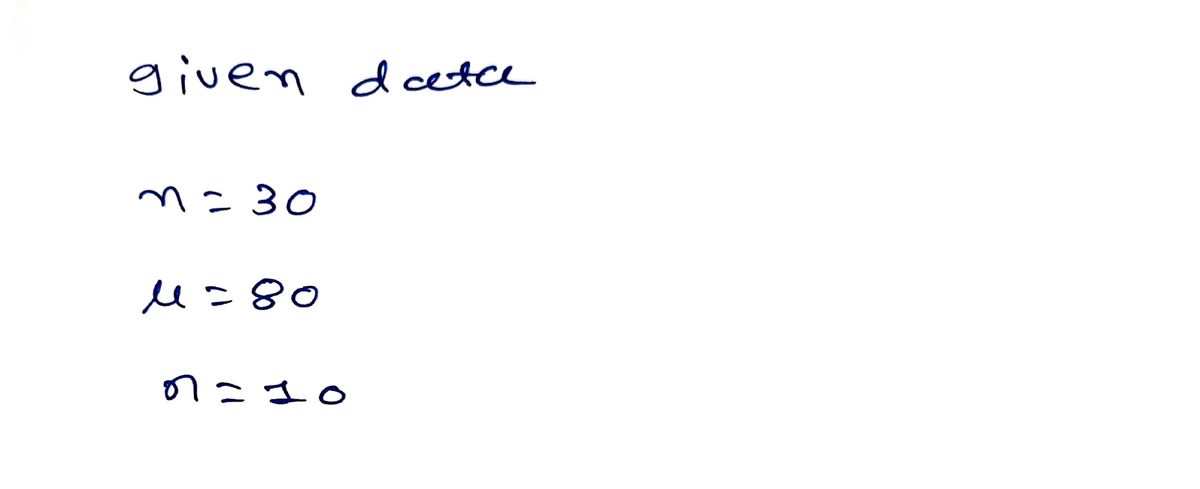
Step 1

Trending nowThis is a popular solution!
Step by stepSolved in 2 steps with 2 images

Knowledge Booster
Similar questions
- An IQ test is designed so that the mean is 100 and the standard deviation is 24 for the population of normal adults. Find the sample size necessary to estimate the mean IQ score of statistics students such that it can be said with 95% confidence that the sample mean is within 8 IQ points of the true mean. Assume tha σ=24 and determine the required sample size using technology. Then determine if this is a reasonable sample size for a real world calculation.The required sample size is enter your response here. (Round up to the nearest integer.) Would it be reasonable to sample this number of students? Yes. This number of IQ test scores is a fairly small number. No. This number of IQ test scores is a fairly small number. Yes. This number of IQ test scores is a fairly large number. No.This number of IQ test scores is a fairly large number.arrow_forward112.1Q)The degree of freedom for the chi squared distribution is 12. Find the value of the 92nd percentile of the chi squared distribution. The value is (Round your answer to three decimal places.)arrow_forwardA sumple from a normal population with mu = 50 and sigma = 6 of M=48.20, . the sample mean.corresponds to tz = - 1.50 , then how many scores are in the sample?arrow_forward
- Please see below. Note that I am only given one attempt at this and I believe that the answer I have may not be correct. In selecting the sample size to estimate the population proportion pp, if we have no knowledge of even the approximate value of the sample proportion p̂ p^, we:A. take two more samples and find the average of their p̂ p^B. let p̂ =0.95p^=0.95C. let p̂ =0.50p^=0.50D. take another sample and estimate p̂ p^ Under which of the following circumstances is it impossible to construct a confidence interval for the population mean?A. A normal population with a large sample and a known population variance.B. A normal population with a small sample and an unknown population variance.C. A non-normal population with a large sample and an unknown population variance.D. A non-normal population with a small sample and an unknown population variance.arrow_forwardIn 1940 the average size of a U.S. farm was 174 acres. Let's say that the standard deviation was 51 acres. Suppose we randomly survey 45 farmers from 1940. I need help with the question below: The middle 50% of the distribution for x̅, the bounds of which form the distance represented by the IQR, lies between what two values? please explain to me the steps I have to do to solve this problem, thank youarrow_forwardSuppose 140 geology students measure the mass of an ore sample. Due to human error and limitations in the reliability of the balance, not all the readings are equal. The results are found to closely approximate a normal curve, with mean 85 g and standard deviation 2 g. Use the symmetry of the normal curve and the empirical rule as needed to estimate the number of students reporting readings between 81 g and 89 g. The number of students reporting readings between 81 g and 89 g is (Round to the nearest whole number as needed.)arrow_forward
- For samples selected for population with a mean of 90 and a standard deviation of 30, what sample size is necessary to make the standard distance between the sample mean and the population mean equal to five points?arrow_forwardWe want to estimate the average time it takes to get relief after taking a painkiller by all patients. Suppose that the population is normally distributed with a standard deviation of 23 minutes. How large a sample should be taken to estimate the population mean time to within 3 minutes with 99% confidence? Sample Size =arrow_forwardSuppose we have the short hand info on a Normal Distribution as N(10,25). What is the population mean of the distribution and what is the population standard deviation? μ = σ =arrow_forward
arrow_back_ios
arrow_forward_ios
Recommended textbooks for you
 MATLAB: An Introduction with ApplicationsStatisticsISBN:9781119256830Author:Amos GilatPublisher:John Wiley & Sons Inc
 Probability and Statistics for Engineering and th...StatisticsISBN:9781305251809Author:Jay L. DevorePublisher:Cengage Learning
 Statistics for The Behavioral Sciences (MindTap C...StatisticsISBN:9781305504912Author:Frederick J Gravetter, Larry B. WallnauPublisher:Cengage Learning
 Elementary Statistics: Picturing the World (7th E...StatisticsISBN:9780134683416Author:Ron Larson, Betsy FarberPublisher:PEARSON
 The Basic Practice of StatisticsStatisticsISBN:9781319042578Author:David S. Moore, William I. Notz, Michael A. FlignerPublisher:W. H. Freeman
 Introduction to the Practice of StatisticsStatisticsISBN:9781319013387Author:David S. Moore, George P. McCabe, Bruce A. CraigPublisher:W. H. Freeman

MATLAB: An Introduction with Applications
Statistics
ISBN:9781119256830
Author:Amos Gilat
Publisher:John Wiley & Sons Inc

Probability and Statistics for Engineering and th...
Statistics
ISBN:9781305251809
Author:Jay L. Devore
Publisher:Cengage Learning

Statistics for The Behavioral Sciences (MindTap C...
Statistics
ISBN:9781305504912
Author:Frederick J Gravetter, Larry B. Wallnau
Publisher:Cengage Learning

Elementary Statistics: Picturing the World (7th E...
Statistics
ISBN:9780134683416
Author:Ron Larson, Betsy Farber
Publisher:PEARSON

The Basic Practice of Statistics
Statistics
ISBN:9781319042578
Author:David S. Moore, William I. Notz, Michael A. Fligner
Publisher:W. H. Freeman

Introduction to the Practice of Statistics
Statistics
ISBN:9781319013387
Author:David S. Moore, George P. McCabe, Bruce A. Craig
Publisher:W. H. Freeman