
MATLAB: An Introduction with Applications
6th Edition
ISBN: 9781119256830
Author: Amos Gilat
Publisher: John Wiley & Sons Inc
expand_more
expand_more
format_list_bulleted
Related questions
Question
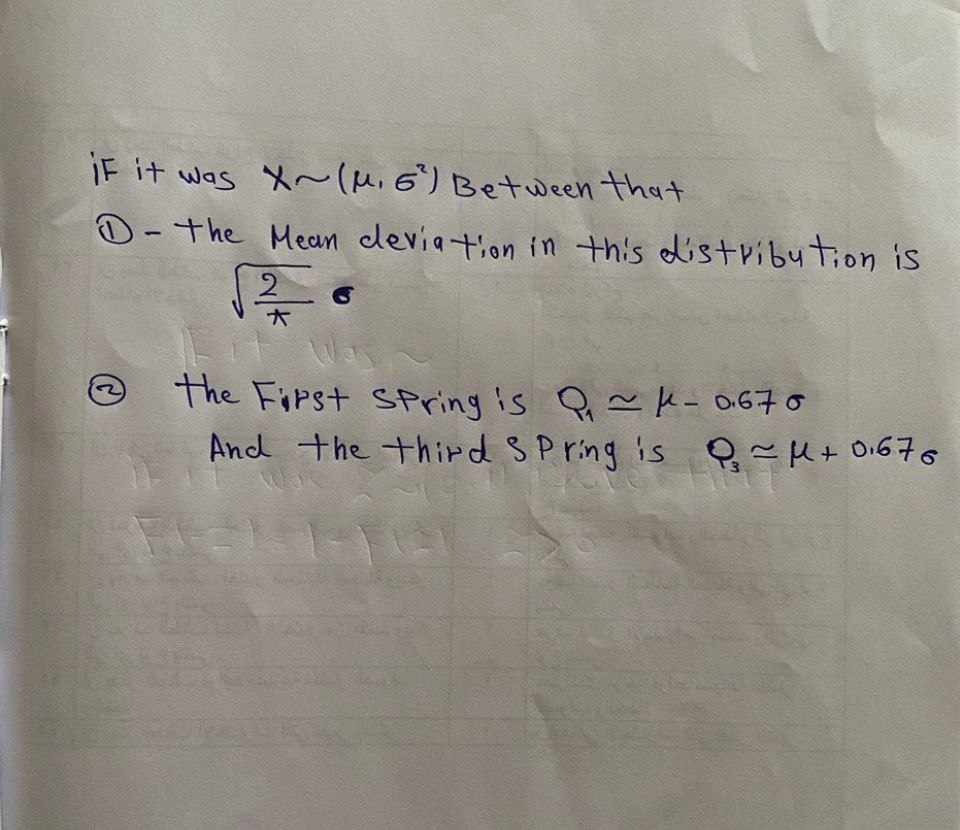

Transcribed Image Text:IF it was X~ (μ.6") Between that
D-the Mean deviation in this distribution is
©
2
A
G
The First Spring is Q₁~μ- 0.670
And the third Spring is Q₁ =μ+0.676
Expert Solution
This question has been solved!
Explore an expertly crafted, step-by-step solution for a thorough understanding of key concepts.

Step by stepSolved in 2 steps

Knowledge Booster

Similar questions
- A population of values has a normal distribution with μ=102.5μ=102.5 and σ=88.6σ=88.6. You intend to draw a random sample of size n=243n=243.What is the mean of the distribution of sample means?μ¯x=μx¯= What is the standard deviation of the distribution of sample means?(Report answer accurate to 2 decimal places.)σ¯x=σx¯=arrow_forwardFuses are known to be normally distributed with a mean failing current of 2 A and a standard deviation of 150 mA (a) Calculate the percentage of the fuses expected to fail at a value greater than 2·3 A (b) Determine the value, to the nearest milliamp, above which 90·3% of the fuses would be expected to fail (c) The fuses are considered to be within tolerance if they have a failure value lying in the range 2 A + / - 220 mA. What percentage of components are likely to be rejected for being out of tolerance?(d) State the 99% confidence limits for the components (e) The board of directors have stated that their expectation of this component is that no more than 3% should be rejected for being out of tolerance, what would be your recommendations to the board with regards to your findings?arrow_forwardIf I draw a sample of 14 scores from a normal distribution with a mean of μ = 10, what is the probability that t=(m - μ)/Sm will fall in the interval ± 1.933? please use excel for all caculations. give the answer to 5 decimal places.arrow_forward
- The lengths of pregnancies in a small rural village are normally distributed with a mean of 267 days and a standard deviation of 15 days. Let X be the length of a randomly recorded pregnancy in the village. What is the distribution of X? X ~ N (,) Please show the following answers to 4 decimal places. If a pregnancy randomly chosen in the village, find the probability that it lasted less than 244 days. If a pregnancy randomly chosen in the village, find the probability that it lasted between 290 and 298 days. Please show the following answer to a whole day. The 72nd percentile pregnancy length in this village is ___________ days.arrow_forwardA normal distribution has a mean of μμ= 54 and a standard deviation of σσ=6 What is the probability of randomly selecting a score GREATER than 51? A normal distribution has a mean of μμ= 54 and a standard deviation of σσ=6 What is the probability of selecting a sample of n = 4 scores with a mean more than M = 51? A normal distribution has a mean of μμ= 54 and a standard deviation of σσ=6 What is the probability of selecting a sample of n = 36 scores with a mean more than M = 51?arrow_forwardJust B pleasearrow_forward
- Q5 Find the variance for the PDF px(x) = e-«/2, x > 0.arrow_forwardThe first thing we need to do is check to see if the distribution is approximately normal. 50(0.6) = 30 and ng = 50(0.4) = 20 np = пр Since np 10 and nq ≥ 10, we can conclude that is approximately a normal distribution with • mean Up • standard deviation op = = 0.6 and pq n = = 0.6(0.4) 50 = pq n 0.24 50 (which is very close to what we saw in our simulation, standard error =0.063). standard error found in the simulation (standard error = 0.030)? ор nearest thousandth). Now find the approximation for samples of size 250. Is the standard deviation close to the = 0.0693 (Round to the Is the standard deviation close to the standard deviation (standard error) found in the simulation?arrow_forwardSolve this problem to find standard deviation to the nearest 10tharrow_forward
- Today, the waves are crashing onto the beach every 5.1 seconds. The times from when a person arrives at the shoreline until a crashing wave is observed follows a Uniform distribution from 0 to 5.1 seconds. Round to 4 decimal places where possible. The mean of this distribution is The standard deviation is The probability that wave will crash onto the beach exactly 1.4 seconds after the person arrives is P(x = 1.4) = The probability that the wave will crash onto the beach between 1.3 and 4.7 seconds after the person arrives is P(1.3 < x < 4.7) = The probability that it will take longer than 3.92 seconds for the wave to crash onto the beach after the person arrives is P(x > 3.92) = Suppose that the person has already been standing at the shoreline for 1.1 seconds without a wave crashing in. Find the probability that it will take between 2.4 and 3.8 seconds for the wave to crash onto the shoreline. 84% of the time a person will wait at least how long before the wave crashes in?…arrow_forwardA study of working actors looked at age and gender. One sample of 50 male actors had a mean age of 26 and a standard deviation of 3. The other sample included 50 female actors with a mean age of 32 and a standard deviation of 2. Estimate with 98% confidence the difference between the average ages of working male (μ1) and female (μ2) actors. Round answers to the nearest hundredth.< μ1−μ2<arrow_forward
arrow_back_ios
arrow_forward_ios
Recommended textbooks for you
- MATLAB: An Introduction with ApplicationsStatisticsISBN:9781119256830Author:Amos GilatPublisher:John Wiley & Sons Inc
 Probability and Statistics for Engineering and th...StatisticsISBN:9781305251809Author:Jay L. DevorePublisher:Cengage Learning
 Statistics for The Behavioral Sciences (MindTap C...StatisticsISBN:9781305504912Author:Frederick J Gravetter, Larry B. WallnauPublisher:Cengage Learning
  Elementary Statistics: Picturing the World (7th E...StatisticsISBN:9780134683416Author:Ron Larson, Betsy FarberPublisher:PEARSON
 The Basic Practice of StatisticsStatisticsISBN:9781319042578Author:David S. Moore, William I. Notz, Michael A. FlignerPublisher:W. H. Freeman
 Introduction to the Practice of StatisticsStatisticsISBN:9781319013387Author:David S. Moore, George P. McCabe, Bruce A. CraigPublisher:W. H. Freeman
MATLAB: An Introduction with Applications
Statistics
ISBN:9781119256830
Author:Amos Gilat
Publisher:John Wiley & Sons Inc
Probability and Statistics for Engineering and th...
Statistics
ISBN:9781305251809
Author:Jay L. Devore
Publisher:Cengage Learning
Statistics for The Behavioral Sciences (MindTap C...
Statistics
ISBN:9781305504912
Author:Frederick J Gravetter, Larry B. Wallnau
Publisher:Cengage Learning
Elementary Statistics: Picturing the World (7th E...
Statistics
ISBN:9780134683416
Author:Ron Larson, Betsy Farber
Publisher:PEARSON
The Basic Practice of Statistics
Statistics
ISBN:9781319042578
Author:David S. Moore, William I. Notz, Michael A. Fligner
Publisher:W. H. Freeman
Introduction to the Practice of Statistics
Statistics
ISBN:9781319013387
Author:David S. Moore, George P. McCabe, Bruce A. Craig
Publisher:W. H. Freeman