MATLAB: An Introduction with Applications
6th Edition
ISBN: 9781119256830
Author: Amos Gilat
Publisher: John Wiley & Sons Inc
expand_more
expand_more
format_list_bulleted
Question

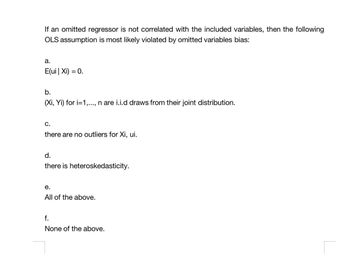
Transcribed Image Text:If an omitted regressor is not correlated with the included variables, then the following
OLS assumption is most likely violated by omitted variables bias:
a.
E(ui | Xi) = 0.
b.
(Xi, Yi) for i=1,..., n are i.i.d draws from their joint distribution.
C.
there are no outliers for Xi, ui.
d.
there is heteroskedasticity.
e.
All of the above.
f.
None of the above.
Expert Solution
This question has been solved!
Explore an expertly crafted, step-by-step solution for a thorough understanding of key concepts.
Step by stepSolved in 4 steps with 15 images

Knowledge Booster
Similar questions
- Question 3 The number of accidents which occurs per week on Johnson's Highway follows the Poisson distribution with mean 1.2. A. B. C. Find the probability that: i. ii. The random variable X~ N(25,100). Find: P(X<29) P(23< X<27) No accidents occur in a particular week More than 2 accidents occur in a given week i. 11. 1. 11. Candles are packaged in bags each containing ten candles. A candle is regarded as overweight if it weighs more than 10 grams. The probability that any one candle produced will be underweight is 0.30. A package of candle is selected at random. Calculate the probability, using a binomial distribution that: no candle is overweight exactly THREE (3) candles are overweightarrow_forwardThe shape of the mean-variance frontier that results from the combination of a riskless and arisky asset is…..:a. Is U-shaped, tilted 90 degrees clockwise.b. Is a straight line passing from the mean-variance points of the two assets.c. Is a hyperbola.d. Consists of two straight lines, each connecting one of the two assets to a risk-freeportfolioarrow_forwardThe question is at end of Merged document.jpg.arrow_forward
- 4. According to the information given below, compute the correlation coefficient and the covariance coefficient between stock A and stock B. Standard deviation of the portfolio (stock A and stock B) :0.37 Standard deviation of the stock A : 0.38 Standard deviation of the stock B :0.43 Weight for stock A : 0.60 Weight for stock B :0.40 NOTE: PLEASE SHOW HOW YOU COMPUTE EACH OF THE ITEMS.arrow_forward1. Two correlation coefficients obtained from samples of size 23 and 28 were computed to be 0.80 and 0.95, respectively. To conclude at levels of 0.05 that whether there is a significant difference between them: a) Compute the test statistics? b) What is your conclusion?arrow_forward6. The assumption of independent is violated whenever: None of these are true. There is a correlation between datapoints within one sample. The samples have unequal sizes. The population distribution is uniform.arrow_forward
- A company's marketing department claims that the number of orders that are placed using theire-commerce store has a Poisson distribution with mean of 3.5 orders per minute. Let X be the number oforders in 1 minute. Let Y be the number of orders in 5 minutes. If the claim of a mean of 3.5 orders perminute is truea. What is P(X <=3)?b. What is the variance for X?c. What is the mean and standard deviation for Y?arrow_forwardA company's marketing department claims that the number of orders that are placed using theire-commerce store has a Poisson distribution with mean of 3.5 orders per minute. Let X be the number oforders in 1 minute. Let Y be the number of orders in 5 minutes. If the claim of a mean of 3.5 orders perminute is true a. What is P(Y = 15)? If the rate of orders falls to 2.1 per minute: b. What is P(X = 1)? c. What is the variance for X?arrow_forwardA set of n = 5 pairs of X and Y scores has SSX = 18, SSY = 8, ∑X=5, ∑Y=15, SSCP = 3. What is the Pearson Product Moment correlation for these scores? answers: a) 18/12 = 1.50 b) 18/144 = .125 c) 3/12 = .25 d) 3/144 = .21arrow_forward
arrow_back_ios
arrow_forward_ios
Recommended textbooks for you
 MATLAB: An Introduction with ApplicationsStatisticsISBN:9781119256830Author:Amos GilatPublisher:John Wiley & Sons Inc
 Probability and Statistics for Engineering and th...StatisticsISBN:9781305251809Author:Jay L. DevorePublisher:Cengage Learning
 Statistics for The Behavioral Sciences (MindTap C...StatisticsISBN:9781305504912Author:Frederick J Gravetter, Larry B. WallnauPublisher:Cengage Learning
 Elementary Statistics: Picturing the World (7th E...StatisticsISBN:9780134683416Author:Ron Larson, Betsy FarberPublisher:PEARSON
 The Basic Practice of StatisticsStatisticsISBN:9781319042578Author:David S. Moore, William I. Notz, Michael A. FlignerPublisher:W. H. Freeman
 Introduction to the Practice of StatisticsStatisticsISBN:9781319013387Author:David S. Moore, George P. McCabe, Bruce A. CraigPublisher:W. H. Freeman

MATLAB: An Introduction with Applications
Statistics
ISBN:9781119256830
Author:Amos Gilat
Publisher:John Wiley & Sons Inc

Probability and Statistics for Engineering and th...
Statistics
ISBN:9781305251809
Author:Jay L. Devore
Publisher:Cengage Learning

Statistics for The Behavioral Sciences (MindTap C...
Statistics
ISBN:9781305504912
Author:Frederick J Gravetter, Larry B. Wallnau
Publisher:Cengage Learning

Elementary Statistics: Picturing the World (7th E...
Statistics
ISBN:9780134683416
Author:Ron Larson, Betsy Farber
Publisher:PEARSON

The Basic Practice of Statistics
Statistics
ISBN:9781319042578
Author:David S. Moore, William I. Notz, Michael A. Fligner
Publisher:W. H. Freeman

Introduction to the Practice of Statistics
Statistics
ISBN:9781319013387
Author:David S. Moore, George P. McCabe, Bruce A. Craig
Publisher:W. H. Freeman