
MATLAB: An Introduction with Applications
6th Edition
ISBN: 9781119256830
Author: Amos Gilat
Publisher: John Wiley & Sons Inc
expand_more
expand_more
format_list_bulleted
Related questions
Question
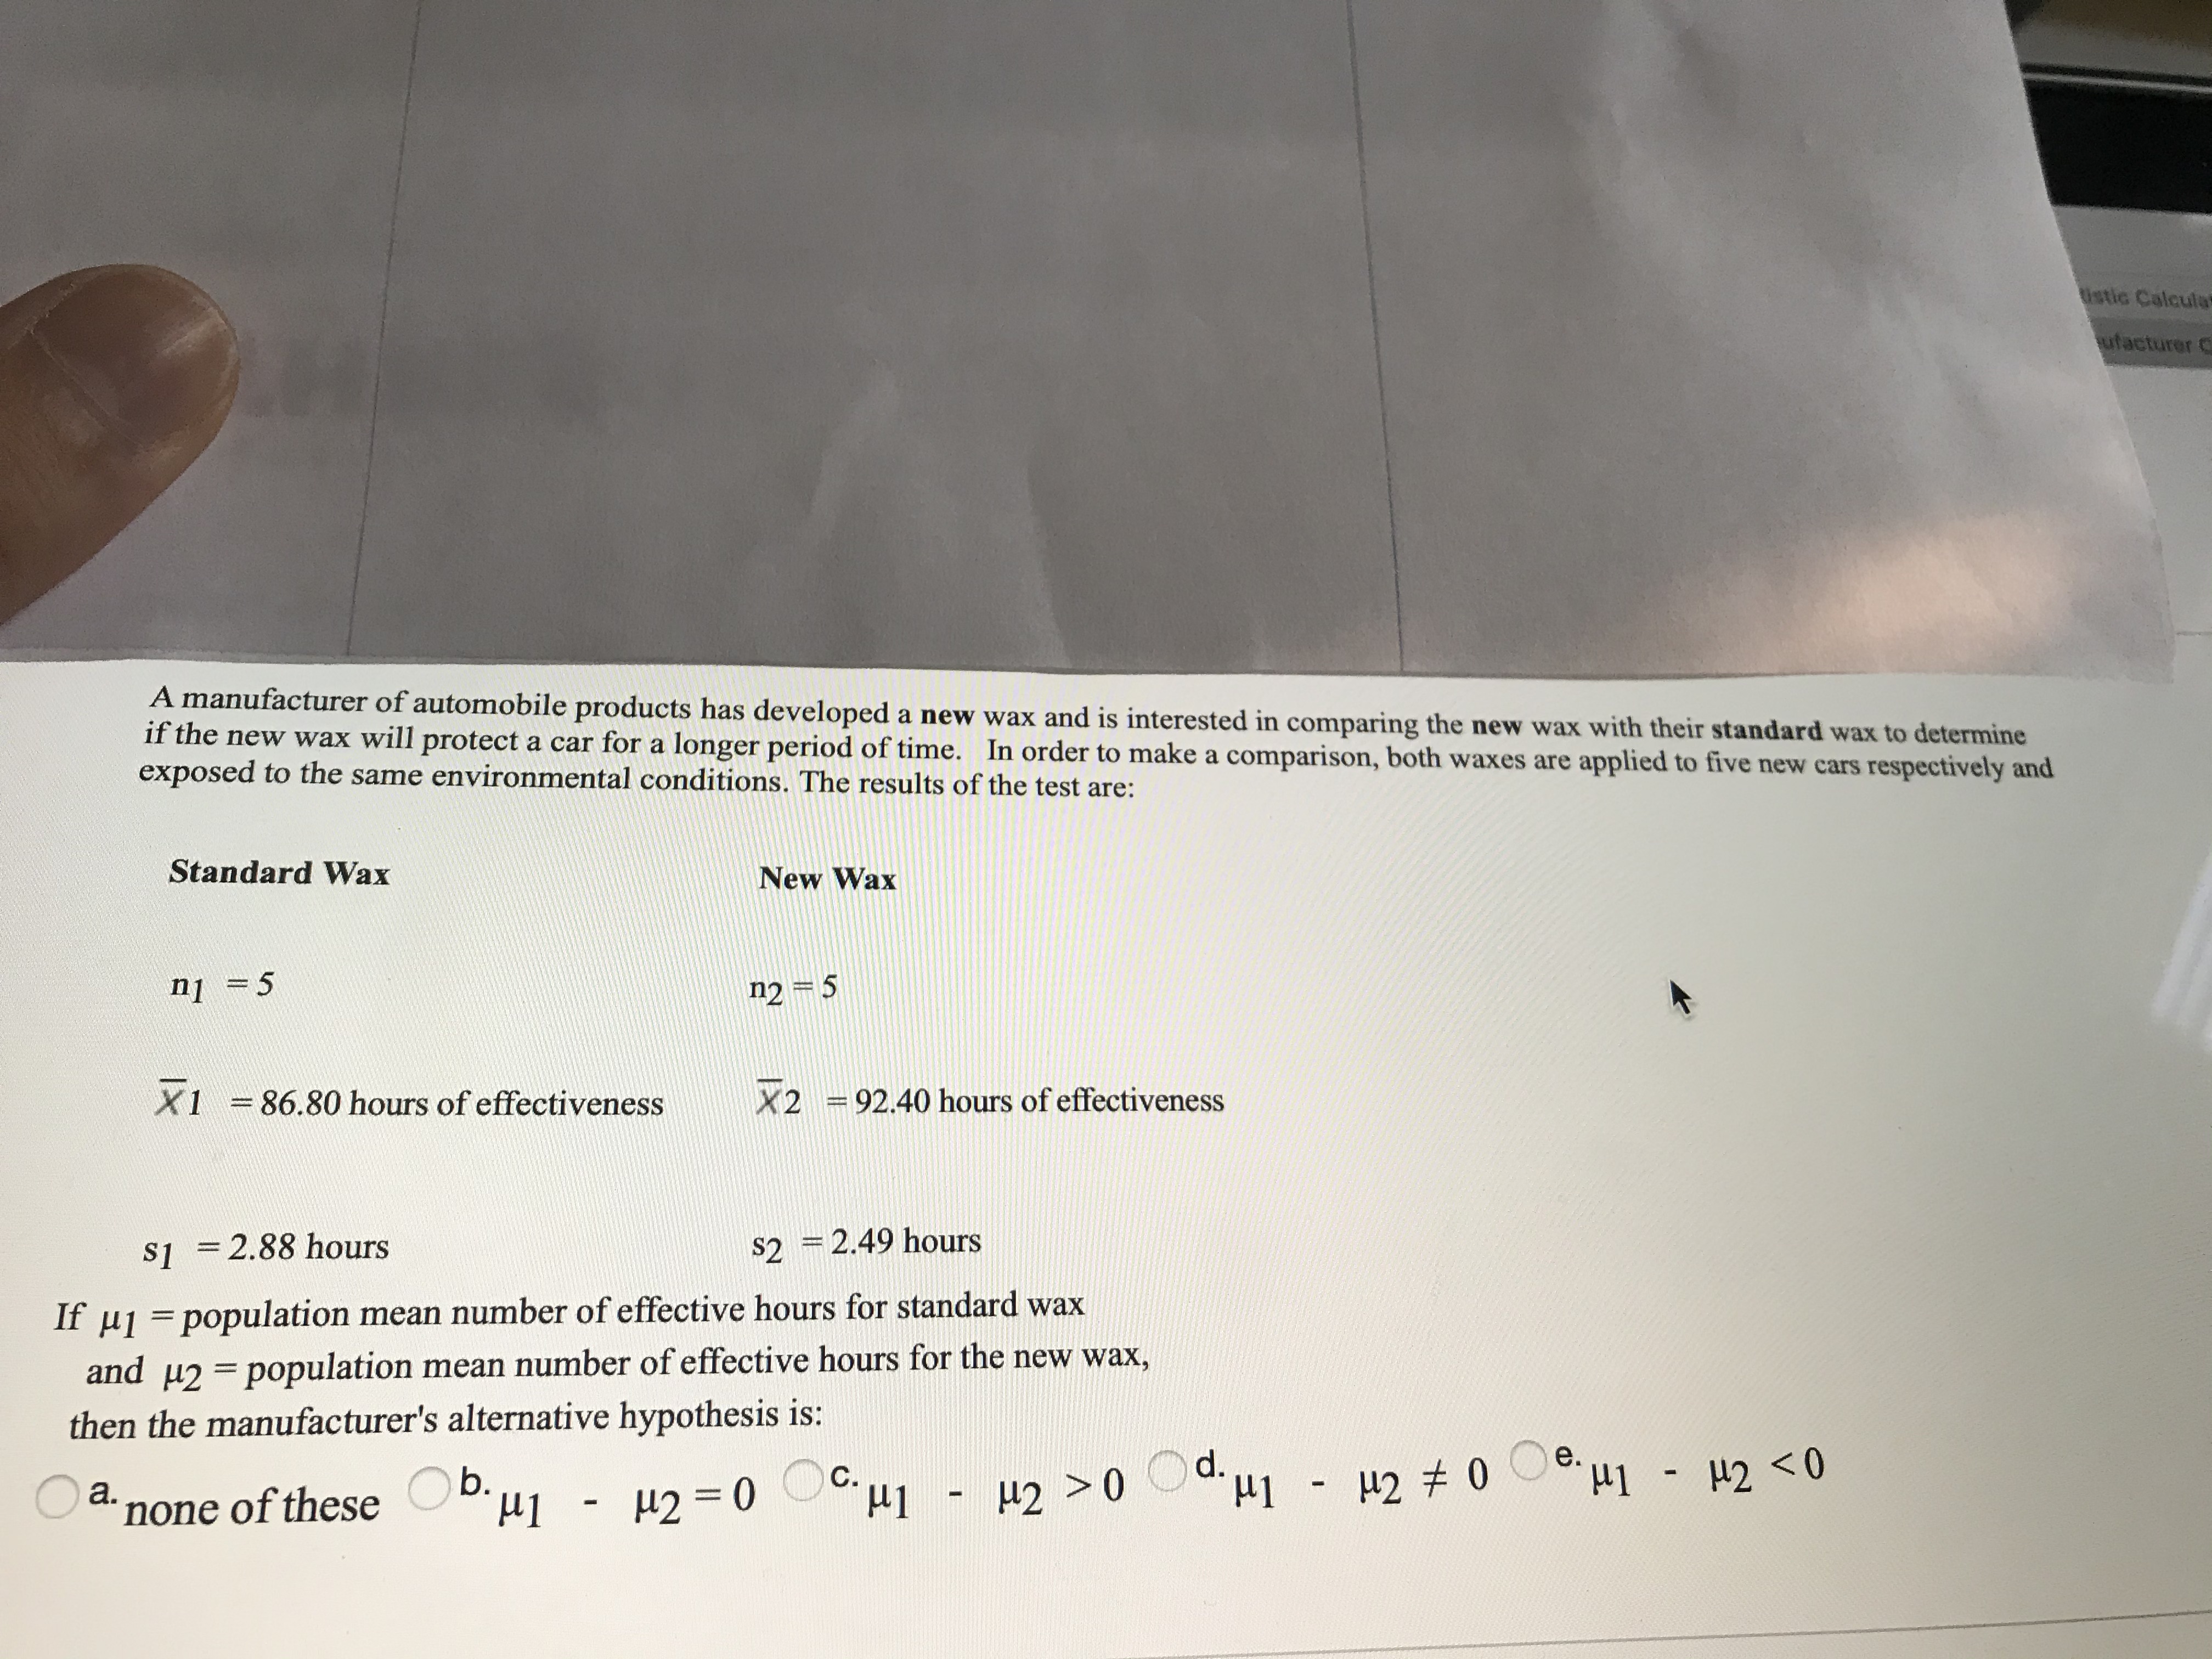

Transcribed Image Text:If µ1 =population mean number of effective hours for standard wax
and u2 = population mean number of effective hours for the new wax,
then the manufacturer's alternative hypothesis is:
%3D
a.
b.
none of these
- H2 =0 C u1
H1 - H2 >0
µ2 >0 Od.u1 - µ2 # 0 Oe u1 - #2 <0
%3D
%3D
Expert Solution
This question has been solved!
Explore an expertly crafted, step-by-step solution for a thorough understanding of key concepts.

This is a popular solution

Trending nowThis is a popular solution!

Step by stepSolved in 2 steps with 2 images

Knowledge Booster


Learn more about
Need a deep-dive on the concept behind this application? Look no further. Learn more about this topic, statistics and related others by exploring similar questions and additional content below.Similar questions
- How would I find d.?arrow_forwardHeights (cm) and weights (kg) are measured for 100 randomly selected adult males, and range from heights of 136 to 187cm and weights of 38 to 150kg. Let the predictor variable x be the first variable given. The 100 paired measurements yield x=167.69cm, y=81.54kg, r=0.241, P-value=0.016,and y=−101+1.04x. Find the best predicted value of y (weight) given an adult male who is 160cm tall. Use a 0.10 significance level. The best predicted value of y for an adult male who is 160cm tall isarrow_forwardCardiorespiratory fitness is widely recognized as a major component of overall physical well-being. Direct measurement of maximal oxygen uptake (VO,max) is the single best measure of such fitness, but direct measurement is time-consuming and expensive. It is therefore desirable to have a prediction equation for VO,max in terms of easily obtained quantities. Consider the following variables. y = vo,max (L/min) x, = weight (kg) X2 = age (yr) X, = time necessary to walk 1 mile (min) x, = heart rate at the end of the walk (beats/min) Here is one possible model for male students, consistent with the information given in the article "Validation of the Rockport Fitness Walking Test in College Males and Females."t Y = 5.0 + 0.01x, - 0.05x, - 0.13x - 0.01x, + € o = 0.4 (a) Interpret B,. O Holding all other variables constant, a 1 kg increase in weight will result in a 0.01 L/min decrease in VO,max. O Holding all other variables constant, a 0.01 kg increase in weight will result in a 1 L/min…arrow_forward
- An article in the San Jose Mercury News stated that students in the California state university system take 4.5 years, on average, to finish their undergraduate degrees. Dr. Lewis believes the mean time for students at Clayton State University is longer than this average. A survey of 49 graduates from Clayton State had a mean time of 5.1 years to complete their Bachelor's degree, with a sample standard deviation of 1.2 years. Correctly identify the null and alternative hypotheses for this study:arrow_forwardHo : H= 1.87 H1 : u tcrit = 1.645, then reject Ho; otherwise fail to reject Ho. Oa = 0.05; one-tailed; if tobt > tcrit= 1.761, then reject Ho; otherwise fail to reject Ho. Oa= 0.05; one-tailed; if zobt < Zcrit = -1.645, then reject Ho; otherwise fail to reject Ho. %3D α. QUESTION 20 For 6 months we worked with a groun of 15 severelv mentally handicapped individuals in an attempt to teach them self-care through imitation. For a second 6- Save All Ar Click Save and Submit to save and submit. Click Save All Answers to save all answers.arrow_forwardHeights (cm) and weights (kg) are measured for 100 randomly selected adult males, and range from heights of 130 to 194 cm and weights of 39 to 150 kg. Let the predictor variable x be the first variable given. The 100 paired measurements yield x=167.94 cm, y=81.53 kg, r=0.203, P-value=0.043, and y=−105+1.13x. Find the best predicted value of y (weight) given an adult male who is 150 cm tall. Use a 0.01 significance level. The best predicted value of y for an adult male who is 150 cm tall is __ kg.arrow_forward
- Japan's high population density has resulted in a multitude of resource-usage problems. One especially serious difficulty concerns waste removal. The article "Innovative Sludge Handling Through Pelletization Thickening"+ reported the development of a new compression machine for processing sewage sludge. An important part of the investigation involved relating the moisture content of compressed pellets (y, in %) to the machine's filtration rate (x, in kg-DS/m/hr). Consider the following data. X 125.1 98.3 201.5 147.1 145.7 124.6 112.2 120.0 161.2 179.0 77.7 76.7 81.5 79.8 y 78.1 78.3 77.4 77.0 80.3 80.2 X 159.7 145.9 75.0 151.3 144.4 125.1 198.6 132.5 159.8 110.7 79.9 78.9 76.8 78.2 79.6 77.9 81.3 76.9 78.8 78.8 Relevant summary quantities are Σx, = 2817.7 Σy, = 1574.1, Σx2 = 415,920.19, Σxy = 222,534.06, Σy? = 123,930.31. Also, X = 140.885, y = 78.71, Sxx = 18,948.5255, Sxy= 766.982, and SSE 10.091. The estimated standard deviation is a = 0.749 and the equation of the least squares is…arrow_forwardHeights (cm) and weights (kg) are measured for 100 randomly selected adult males, and range from heights of 135 to 191 cm and weights of 37 to 150kg. Let the predictor variable x be the first variable given. The 100 paired measurements yield x=167.79cm, y=81.51kg, r=0.293, P-value=0.003, and y=−106+1.17x. Find the best-predicted value of y (weight) given an adult male who is 147cm tall. Use a 0.10 significance level.arrow_forwardA student is interested in knowing if there is a relationship between the age of a child and the amount of time spent on homework. He asks 7 people their ages and the number of hours they spend on homework. Is there a relationship between age and the amount of time spent doing homework? Test at α = .05 level of significance. Age of Child (yrs) Time doing HW (hrs) 11 5 15 7 4 0 7 1 9 2 5 0 13 3arrow_forward
- An experiment to compare the tension bond strength of polymer latex modified mortar (Portland cement mortar to which polymer latex emulsions have been added during mixing) to that of unmodified mortar resulted in x = 18.19 kgf/cm? for the modified mortar (m = 42) and y = 16.85 kgf/cm? for the unmodified mortar (n = 30). Let u, and u, be the true average tension bond strengths for the modified and unmodified mortars, respectively. Assume that the bond strength distributions are both normal. Assuming that o, = 1.6 and o, = 1.3, test Hn: 4, - H, = 0 versus H: u, - u, > 0 at level 0.01. Calculate the test statistic and determine the P-value. (Round your test statistic to two decimal places and your P-value to four decimal places.) P-value = Compute the probability of a type II error for the test of part (a) when 4 - Hz = 1. (Round your answer to four decimal places.) Suppose the investigator decided to use a level 0.05 test and vwished B = 0.10 when u, - uz = 1. If m = 42, what value of n…arrow_forwardHeights (cm) and weights (kg) are measured for 100 randomly selected adult males, and range from heights of 135 to190 cm and weights of 39to150kg. Let the predictor variable x be the first variable given. The 100 paired measurements yield x̄ =167.89 cm, ȳ = 81.55kg, r=0.414, P- value=0.000, and ŷ =−103+1.04x. Find the best predicted value of ŷ (weight) given an adult male who is184 cm tall. Use a 0.05 significance level. The best predicted value of ŷ for an adult male who is 184 cm tall is ___kg.arrow_forwardThe sulfate ion concentration in natural water can be determined by measuring the turbidity that results when an excess of BaCl2 is added to a measured quantity of the sample. A turbiditimeter, the instrument used for this analysis, was calibrated with a series of standard Na2SO4 solutions. The following data were obtained for the calibration:arrow_forward
arrow_back_ios
SEE MORE QUESTIONS
arrow_forward_ios
Recommended textbooks for you
- MATLAB: An Introduction with ApplicationsStatisticsISBN:9781119256830Author:Amos GilatPublisher:John Wiley & Sons Inc
 Probability and Statistics for Engineering and th...StatisticsISBN:9781305251809Author:Jay L. DevorePublisher:Cengage Learning
 Statistics for The Behavioral Sciences (MindTap C...StatisticsISBN:9781305504912Author:Frederick J Gravetter, Larry B. WallnauPublisher:Cengage Learning
  Elementary Statistics: Picturing the World (7th E...StatisticsISBN:9780134683416Author:Ron Larson, Betsy FarberPublisher:PEARSON
 The Basic Practice of StatisticsStatisticsISBN:9781319042578Author:David S. Moore, William I. Notz, Michael A. FlignerPublisher:W. H. Freeman
 Introduction to the Practice of StatisticsStatisticsISBN:9781319013387Author:David S. Moore, George P. McCabe, Bruce A. CraigPublisher:W. H. Freeman
MATLAB: An Introduction with Applications
Statistics
ISBN:9781119256830
Author:Amos Gilat
Publisher:John Wiley & Sons Inc
Probability and Statistics for Engineering and th...
Statistics
ISBN:9781305251809
Author:Jay L. Devore
Publisher:Cengage Learning
Statistics for The Behavioral Sciences (MindTap C...
Statistics
ISBN:9781305504912
Author:Frederick J Gravetter, Larry B. Wallnau
Publisher:Cengage Learning
Elementary Statistics: Picturing the World (7th E...
Statistics
ISBN:9780134683416
Author:Ron Larson, Betsy Farber
Publisher:PEARSON
The Basic Practice of Statistics
Statistics
ISBN:9781319042578
Author:David S. Moore, William I. Notz, Michael A. Fligner
Publisher:W. H. Freeman
Introduction to the Practice of Statistics
Statistics
ISBN:9781319013387
Author:David S. Moore, George P. McCabe, Bruce A. Craig
Publisher:W. H. Freeman