
MATLAB: An Introduction with Applications
6th Edition
ISBN: 9781119256830
Author: Amos Gilat
Publisher: John Wiley & Sons Inc
expand_more
expand_more
format_list_bulleted
Related questions
Question
Need help with statistics homework question asap! 17
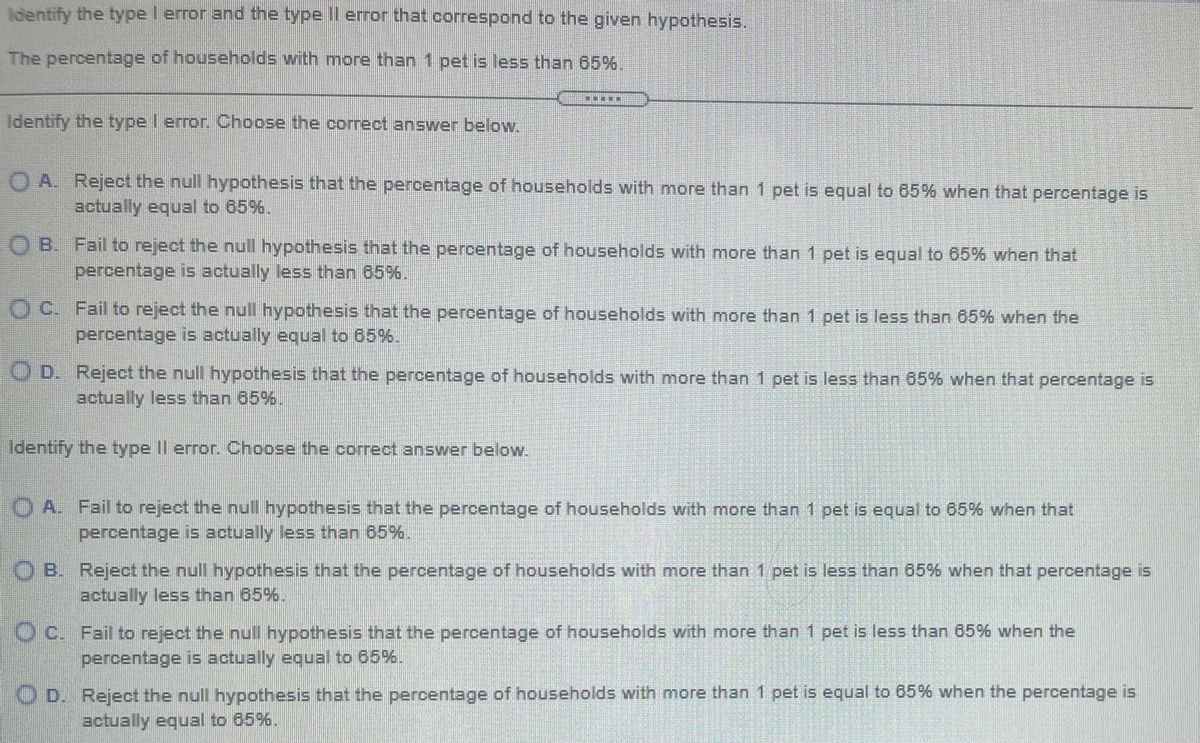

Transcribed Image Text:Identify the type I error and the type Il error that correspond to the given hypothesis.
The percentage of households with more than 1 pet is less than 65%.
Identify the type Ierror. Choose the correct answer below.
O A. Reject the null hypothesis that the percentage of households with more than 1 pet is equal to 65% when that percentage is
actually equal to 65%.
O B. Fail to reject the null hypothesis that the percentage of households with more than 1 pet is equal to 65% when that
percentage is actually less than 65%.
O C. Fail to reject the null hypothesis that the percentage of households with more than 1 pet is less than 65% when the
percentage is actually equal to 65%.
O D. Reject the null hypothesis that the percentage of households with more than 1 pet is less than 65% when that percentage is
actually less than 65%.
Identify the type Il error. Choose the correct answer below.
O A. Fail to reject the null hypothesis that the percentage of households with more than 1 pet is equal to 65% when that
percentage is actually less than 65%.
O B. Reject the null hypothesis that the percentage of households with more than 1 pet is less than 65% when that percentage is
actually less than 65%.
O c. Fail to reject the null hypothesis that the percentage of households with more than 1 pet is less than 65% when the
percentage is actually equal to 65%.
O D. Reject the null hypothesis that the percentage of households with more than 1 pet is equal to 65% when the percentage is
actually equal to 65%.
Expert Solution
This question has been solved!
Explore an expertly crafted, step-by-step solution for a thorough understanding of key concepts.

This is a popular solution

Trending nowThis is a popular solution!

Step by stepSolved in 2 steps with 1 images

Knowledge Booster

Similar questions
- Can you please explain to me how to solve number 14. I think I’m missing something to solving itarrow_forwardThe Methods section of a research paper is where the researchers describe the statistical analyses that they employed. True Falsearrow_forwardWould observations or interviews be more appropriate to research the following topic?How veterans find employment after exiting military service.O ObservationsO Interviewsarrow_forward
- Important: This question continues from the previous two questions and onto the following two questions. A Rasmussen Reports national survey of 1000 random adult Americans found that 6% felt that Saint Patrick's Day was one of our nation's most important holidays. From the previous question, input the calculated number of successes and number of failures. Show your work on your scratch paper. The number of successes is The number of failures is .Write your answer as a whole number. . Write your answer as a whole number.arrow_forwardYou saw back in Chapter 2 that the mean, median, mode, and midrange are used to indicate where data is centered in a data set, or in other words what a typical value in the set is. A question that is often asked is, "If they're all supposed to do the same thing, why is there more than one?" Isn't one enough? In this exercise, you will be given two small sets of data. For each set, a. find the mean, median, mode and midrange b. in your opinion, decide which of the measures BEST represents all the values in the set (best indicates a typical value), and which one does this the WORST. c. post your responses and justify them by explaining why Don't forget to respond to at least one of your classmate's posts. With this exercise, "more is better." I'll elaborate after the deadline. • Set A: the salaries of 10 employees at a company (in thousands of dollars): 50, 50, 50, 50, 50, 50, 50, 50, 50, 500 • Set B: the grades of 9 students on an exam: 20, 25, 30, 35, 40, 45, 100, 100, 100arrow_forwardIn statistics, the data we work with is just one part of a bigger picture called the ____. In statistics, the data we work with is just one part of a bigger picture called thearrow_forward
- Two sections of statistics are offered, the first at 8 a.m. and the second at 10 a.m. The 8 a.m. section has 25 women, and the 10 a.m. section has 15 women. A student claims this is evidence that women prefer earlier statistics classes than men do. What information is missing that might contradict this claim? Question content area bottom Part 1 Choose the best answer below. A. The professor may be female in one class and male in the other, which could affect the female students' class preference. B. The percentage of female students in the two classes is unknown. There may be more females in the 8 a.m. because there are more students in the 8 a.m. class than the 10 a.m. class. This claim could be true only if the classes were the same size. C. The age and class standing of the students is unknown. Older female students may prefer later classes, so it may be only younger female students who prefer earlier classes. D. No information is…arrow_forwardPlease solve this question below. Thank you! 9. Challenge A bag contains 200 red and blue marbles. Three people each took samples of 25 marbles and noted the number of red marbles. Person A 17 red marbles out of 25 marbles Person B 12 red marbles out of 25 marbles Person C 20 red marbles out of 25 marbles a. Combine the samples to make one large sample. Use that sample to predict the number of red marbles in a similar bag that contains 300 marbles. b. Explain how having a fourth sample would make the estimate better.arrow_forwardPlease Answert the questions in the photo. Thank You!arrow_forward
- Please explain the concept and if you do handwritten i will have to dislike and pls conceptarrow_forwardWhat test would you use if you want to determine whether gender and major depend upon one another? We are reading Chapter 11 of business statisticsarrow_forwardIs the number two in the sentence a statistic or a perimeter? Two students out of all 29 students in a class have red hair.arrow_forward
arrow_back_ios
SEE MORE QUESTIONS
arrow_forward_ios
Recommended textbooks for you
- MATLAB: An Introduction with ApplicationsStatisticsISBN:9781119256830Author:Amos GilatPublisher:John Wiley & Sons Inc
 Probability and Statistics for Engineering and th...StatisticsISBN:9781305251809Author:Jay L. DevorePublisher:Cengage Learning
 Statistics for The Behavioral Sciences (MindTap C...StatisticsISBN:9781305504912Author:Frederick J Gravetter, Larry B. WallnauPublisher:Cengage Learning
  Elementary Statistics: Picturing the World (7th E...StatisticsISBN:9780134683416Author:Ron Larson, Betsy FarberPublisher:PEARSON
 The Basic Practice of StatisticsStatisticsISBN:9781319042578Author:David S. Moore, William I. Notz, Michael A. FlignerPublisher:W. H. Freeman
 Introduction to the Practice of StatisticsStatisticsISBN:9781319013387Author:David S. Moore, George P. McCabe, Bruce A. CraigPublisher:W. H. Freeman
MATLAB: An Introduction with Applications
Statistics
ISBN:9781119256830
Author:Amos Gilat
Publisher:John Wiley & Sons Inc
Probability and Statistics for Engineering and th...
Statistics
ISBN:9781305251809
Author:Jay L. Devore
Publisher:Cengage Learning
Statistics for The Behavioral Sciences (MindTap C...
Statistics
ISBN:9781305504912
Author:Frederick J Gravetter, Larry B. Wallnau
Publisher:Cengage Learning
Elementary Statistics: Picturing the World (7th E...
Statistics
ISBN:9780134683416
Author:Ron Larson, Betsy Farber
Publisher:PEARSON
The Basic Practice of Statistics
Statistics
ISBN:9781319042578
Author:David S. Moore, William I. Notz, Michael A. Fligner
Publisher:W. H. Freeman
Introduction to the Practice of Statistics
Statistics
ISBN:9781319013387
Author:David S. Moore, George P. McCabe, Bruce A. Craig
Publisher:W. H. Freeman