MATLAB: An Introduction with Applications
6th Edition
ISBN: 9781119256830
Author: Amos Gilat
Publisher: John Wiley & Sons Inc
expand_more
expand_more
format_list_bulleted
Question

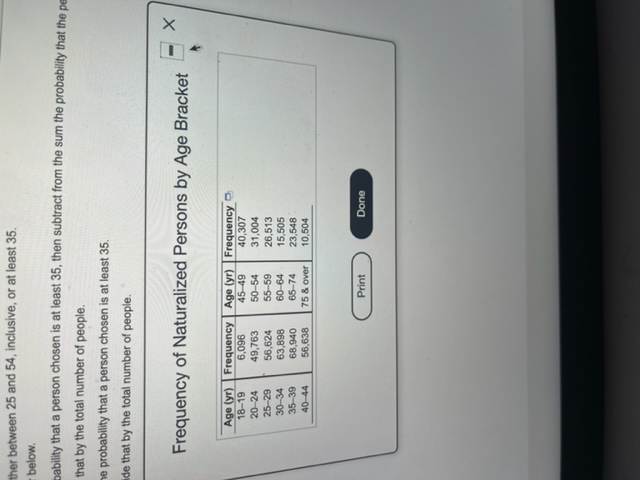
Transcribed Image Text:### Frequency of Naturalized Persons by Age Bracket
This dataset presents the frequency of naturalized persons categorized by various age brackets. The information is organized into two columns: "Age (yr)" representing the age range, and "Frequency" indicating the number of naturalized individuals within each age range.
| Age (yr) | Frequency |
|----------|-----------|
| 18–19 | 6,096 |
| 20–24 | 49,763 |
| 25–29 | 50,296 |
| 30–34 | 58,898 |
| 35–39 | 69,840 |
| 40–44 | 56,638 |
| 45–49 | 40,307 |
| 50–54 | 31,004 |
| 55–59 | 26,513 |
| 60–64 | 20,554 |
| 65–74 | 15,005 |
| 75+ | 10,504 |
This table provides a clear view of how naturalization is distributed across different age groups, which can be useful for analyzing demographic trends in naturalization processes.

Transcribed Image Text:**Identify the probability of the event without using the general addition rule.**
The probability that the age of the person obtained is either between 25 and 54, inclusive, or at least 35 is ____.
*(Type an integer or a decimal. Round to three decimal places as needed.)*
Expert Solution
This question has been solved!
Explore an expertly crafted, step-by-step solution for a thorough understanding of key concepts.
This is a popular solution
Trending nowThis is a popular solution!
Step by stepSolved in 2 steps

Knowledge Booster
Similar questions
- A die is rolled twice. What is the probability of showing a two on the first roll and an even number on the second roll? Answer using a fraction or a decimal rounded to three places.arrow_forwardGive the probability in decimal form (correct to two decimal places). A calculator may be helpful with this problem. Last year, 1,455 calculators were returned to the manufacturer. If 83,000 were produced, assign a number to specify the probability that a particular calculator would be returned. Need Help? Read It Additional Materials Tech Guide: Excel Tech Guide: TI-83/84 Tech Guide: TI-Nspirearrow_forwardUse the formula for the probability of the complement of an event.A pair of dice is rolled 3 times. What is the probability that a sum of 5 on the 2 dice will occur at least once? (Round your answer to three decimal places.)arrow_forward
- If you are dealt 3 cards from a shuffled deck of 52 cards, find the probability of getting one queen and two kings. The probability is (Round to six decimal places as needed.)arrow_forwardTwo cards are selected from a standard deck of 52 playing cards. The first card is not replaced before the second card is selected. Find the probability of selecting a heart and then selecting a diamond . Round your answer to three decimal places.arrow_forwardRaffle tickets numbered consecutively from 101 through 350 are placed in a box. What is the probability that a ticket selected at random will have a number with a hundreds digit of 2 ?arrow_forward
- A standard die is rolled. Find the probability that the number rolled is greater than 3. Express your answer as a fraction in lowest terms or a decimal rounded to the nearest millionth.arrow_forwardAnswer letter a to c.arrow_forwardIf the probability is 0.37 that a candidate loses the election, what is the probability that he wins? ..... The probability the candidate wins the election is. (Simplify your answer. Type an integer or a decimal.)arrow_forward
- Assume that male and female births are equally likely and that the birth of any child does not affect the probability of the gender of any other children. Find the probability of exactly two boys in ten births. Round the answer to the nearest thousandth.arrow_forwardGive the probability in decimal form (correct to two decimal places). A calculator may be helpful with this problem.The campus vets club is having a raffle and is selling 1,500 tickets. If the people on your floor of the dorm bought 255 of those tickets, what is the probability that someone on your floor will hold the winning ticket?arrow_forwardSolve the following:arrow_forward
arrow_back_ios
arrow_forward_ios
Recommended textbooks for you
 MATLAB: An Introduction with ApplicationsStatisticsISBN:9781119256830Author:Amos GilatPublisher:John Wiley & Sons Inc
 Probability and Statistics for Engineering and th...StatisticsISBN:9781305251809Author:Jay L. DevorePublisher:Cengage Learning
 Statistics for The Behavioral Sciences (MindTap C...StatisticsISBN:9781305504912Author:Frederick J Gravetter, Larry B. WallnauPublisher:Cengage Learning
 Elementary Statistics: Picturing the World (7th E...StatisticsISBN:9780134683416Author:Ron Larson, Betsy FarberPublisher:PEARSON
 The Basic Practice of StatisticsStatisticsISBN:9781319042578Author:David S. Moore, William I. Notz, Michael A. FlignerPublisher:W. H. Freeman
 Introduction to the Practice of StatisticsStatisticsISBN:9781319013387Author:David S. Moore, George P. McCabe, Bruce A. CraigPublisher:W. H. Freeman

MATLAB: An Introduction with Applications
Statistics
ISBN:9781119256830
Author:Amos Gilat
Publisher:John Wiley & Sons Inc

Probability and Statistics for Engineering and th...
Statistics
ISBN:9781305251809
Author:Jay L. Devore
Publisher:Cengage Learning

Statistics for The Behavioral Sciences (MindTap C...
Statistics
ISBN:9781305504912
Author:Frederick J Gravetter, Larry B. Wallnau
Publisher:Cengage Learning

Elementary Statistics: Picturing the World (7th E...
Statistics
ISBN:9780134683416
Author:Ron Larson, Betsy Farber
Publisher:PEARSON

The Basic Practice of Statistics
Statistics
ISBN:9781319042578
Author:David S. Moore, William I. Notz, Michael A. Fligner
Publisher:W. H. Freeman

Introduction to the Practice of Statistics
Statistics
ISBN:9781319013387
Author:David S. Moore, George P. McCabe, Bruce A. Craig
Publisher:W. H. Freeman