MATLAB: An Introduction with Applications
6th Edition
ISBN: 9781119256830
Author: Amos Gilat
Publisher: John Wiley & Sons Inc
expand_more
expand_more
format_list_bulleted
Question
A) find the critical vales
b) find the Z score

Transcribed Image Text:←
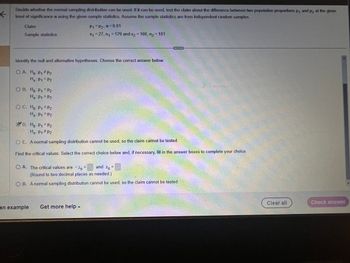
Decide whether the normal sampling distribution can be used. If it can be used, test the clairn about the difference between two population proportions
level of significance a using the given sample statistics. Assume the sample statistics are from independent random samples.
Claim
Sample statistics:
Identify the null and alternative hypotheses. Choose the correct answer below.
OA. Ho: P₁ P₂
Ha P₁ = P2
OB. Ho P1 P2
Ha: P₁
P2
O C. Ho P₁ P2
H₂- P1 = P2
P₁=P₂, α=0.01
x₁ = 27, n₁ = 129 and x₂ = 160, n₂ = 181
D. Ho: P₁ P2
Ha- P₁ #P2
OE. A normal sampling distribution cannot be used, so the claim cannot be tested.
Find the critical values. Select the correct choice below and, if necessary, fill in the answer boxes to complete your
O A. The critical values are -Zo =
=
and Zo
(Round to two decimal places as needed.)
O B. A normal sampling distribution cannot be used, so the claim cannot be tested.
an example Get more help -
choice.
Clear all
P₁
and P2
at the given
Check answer
Expert Solution
This question has been solved!
Explore an expertly crafted, step-by-step solution for a thorough understanding of key concepts.
This is a popular solution
Trending nowThis is a popular solution!
Step by stepSolved in 4 steps with 10 images

Knowledge Booster
Similar questions
- The power of the slope t-test is NOT determined by: A)direction of slope B) sample size C) effect size D) alphaarrow_forward5. The table below shows the temperature for each month in St. Pete, Florida. Use the table to find the 5 number summary and IQR. Min: Month Jan Feb Mar Apr May Jun 64 68 Temp 63 74 80 Min: 16 4 (3756 10 Find the 5 number summary: Are there any outliers? Show work. ( 18 Name Al Time (sec) Q1: 11.3 Q1: Median: Find the 5 number summary: 16. Median: Is 18.6 an outlier? Show work. 6. The following gives the time it takes to run 100M with 10 friends. Use the table to find the 5 number summary and IQR. 5 10 3 10 00 0-8-1-57 5 (12) 84 86, 86 Q3: 10.3 July Aug Sept 84 Beth Cindy David Emily Frank Gary Helen Ida 12.9 11.9 11.1 10.8 10.5 12.0 154 Q3: Max: 18.6 1500 Oct Nov Dec 70 78 48 IOR: Max: Jay 10.9 IQR:arrow_forwardHarper collected data on students who make appointments to see their advisor to see how many failed to show up. The student records were divided into two groups: male (group 1) and female (group 2). A 93% confidnece interval for pi – P2 was found to be as follows: (0.03, 0.09) Interpret the endpoints of this interval in the context of this problem. Do not use the word "difference" in your answer.arrow_forward
- A researcher want to know if there is a relationship between sleep and anxiety. The researcher randomly selected n = 5 participants and asked each to rate their sleep quality and anxiety level on a scale of 1 to 5. The data are below: Sleep X Anxiety Y 2 2 3 3 2 2 4 2 5 2 Calculate the Sum of Squares for X (SSX)arrow_forwardMay I know the examples of interval and ratioarrow_forwardShow necessary calculation/justification for each answer. a) In regression analysis, the residuals represent the:a. difference between the actual y values and their predicted values.b. difference between the actual x values and their predicted values.c. square root of the slope of the regression line.d. change in y per unit change in x. b) The least squares method for determining the best fit minimizes:a. total variation in the dependent variableb. sum of squares for errorc. sum of squares for regressiond. All of these choices are true. c) The regression line has been fitted to the data points (4, 8), (2, 5), and (1, 2).The sum of the squared residuals will be:a. 7b. 15c. 8d. 22arrow_forward
arrow_back_ios
arrow_forward_ios
Recommended textbooks for you
 MATLAB: An Introduction with ApplicationsStatisticsISBN:9781119256830Author:Amos GilatPublisher:John Wiley & Sons Inc
 Probability and Statistics for Engineering and th...StatisticsISBN:9781305251809Author:Jay L. DevorePublisher:Cengage Learning
 Statistics for The Behavioral Sciences (MindTap C...StatisticsISBN:9781305504912Author:Frederick J Gravetter, Larry B. WallnauPublisher:Cengage Learning
 Elementary Statistics: Picturing the World (7th E...StatisticsISBN:9780134683416Author:Ron Larson, Betsy FarberPublisher:PEARSON
 The Basic Practice of StatisticsStatisticsISBN:9781319042578Author:David S. Moore, William I. Notz, Michael A. FlignerPublisher:W. H. Freeman
 Introduction to the Practice of StatisticsStatisticsISBN:9781319013387Author:David S. Moore, George P. McCabe, Bruce A. CraigPublisher:W. H. Freeman

MATLAB: An Introduction with Applications
Statistics
ISBN:9781119256830
Author:Amos Gilat
Publisher:John Wiley & Sons Inc

Probability and Statistics for Engineering and th...
Statistics
ISBN:9781305251809
Author:Jay L. Devore
Publisher:Cengage Learning

Statistics for The Behavioral Sciences (MindTap C...
Statistics
ISBN:9781305504912
Author:Frederick J Gravetter, Larry B. Wallnau
Publisher:Cengage Learning

Elementary Statistics: Picturing the World (7th E...
Statistics
ISBN:9780134683416
Author:Ron Larson, Betsy Farber
Publisher:PEARSON

The Basic Practice of Statistics
Statistics
ISBN:9781319042578
Author:David S. Moore, William I. Notz, Michael A. Fligner
Publisher:W. H. Freeman

Introduction to the Practice of Statistics
Statistics
ISBN:9781319013387
Author:David S. Moore, George P. McCabe, Bruce A. Craig
Publisher:W. H. Freeman