
MATLAB: An Introduction with Applications
6th Edition
ISBN: 9781119256830
Author: Amos Gilat
Publisher: John Wiley & Sons Inc
expand_more
expand_more
format_list_bulleted
Related questions
Question
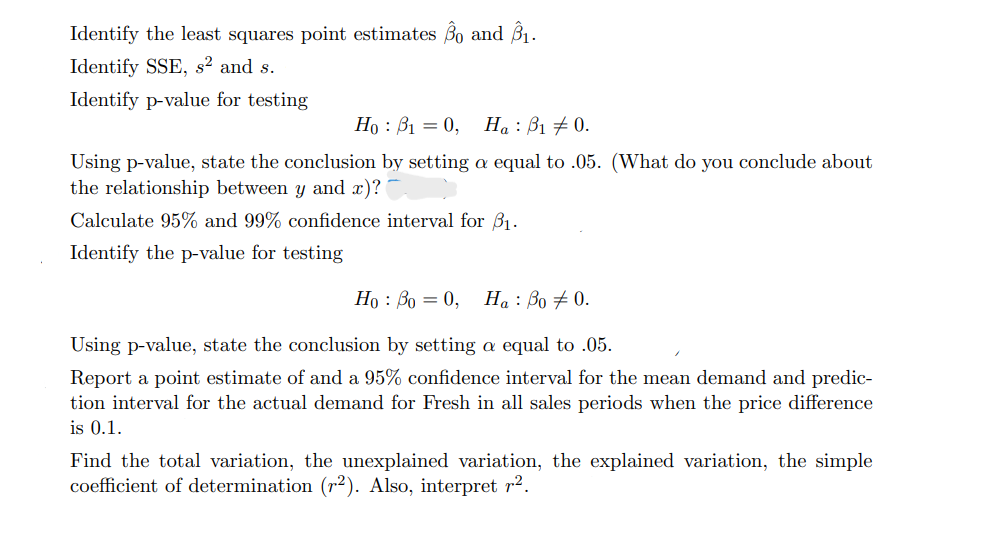

Transcribed Image Text:Identify the least squares point estimates 30 and 3₁.
Identify SSE, s² and s.
Identify p-value for testing
Ho 10, Ha: ₁0.
Using p-value, state the conclusion by setting a equal to .05. (What do you conclude about
the relationship between y and x)?
Calculate 95% and 99% confidence interval for ₁.
Identify the p-value for testing
Ho: Po = 0,
Ha : Bo 0.
Using p-value, state the conclusion by setting a equal to .05.
Report a point estimate of and a 95% confidence interval for the mean demand and predic-
tion interval for the actual demand for Fresh in all sales periods when the price difference
is 0.1.
Find the total variation, the unexplained variation, the explained variation, the simple
coefficient of determination (r2). Also, interpret r².

Transcribed Image Text:A
1 Demand
2
WN
3
4
5
6
7
8
9
10
11
12
13
14
15
16
17
18
19
20
21
22
23
24
25
26
27
28
29
30
31
32
7.38
8.51
9.52
7.50
9.33
8.28
8.75
7.87
7.10
8.00
7.89
8.15
9.10
8.86
8.90
8.87
9.26
9.00
8.75
7.95
7.65
7.27
8.00
8.50
8.75
9.21
8.27
7.67
7.93
9.26
B
PriceDif
-0.05
0.25
0.60
0.00
0.25
0.20
0.15
0.05
-0.15
0.15
0.20
0.10
0.40
0.45
0.35
0.30
0.50
0.50
0.40
-0.05
-0.05
-0.10
0.20
0.10
0.50
0.60
-0.05
0.00
0.05
0.55
C
Expert Solution
arrow_forward
Step 1: Write the given information.
| Demand | Price Diff |
| 7.38 | -0.05 |
| 8.51 | 0.25 |
| 9.52 | 0.6 |
| 7.5 | 0 |
| 9.33 | 0.25 |
| 8.28 | 0.2 |
| 8.75 | 0.15 |
| 7.87 | 0.05 |
| 7.1 | -0.15 |
| 8 | 0.15 |
| 7.89 | 0.2 |
| 8.15 | 0.1 |
| 9.1 | 0.4 |
| 8.86 | 0.45 |
| 8.9 | 0.35 |
| 8.87 | 0.3 |
| 9.26 | 0.5 |
| 9 | 0.5 |
| 8.75 | 0.4 |
| 7.95 | -0.05 |
| 7.65 | -0.05 |
| 7.27 | -0.1 |
| 8 | 0.2 |
| 8.5 | 0.1 |
| 8.75 | 0.5 |
| 9.21 | 0.6 |
| 8.27 | -0.05 |
| 7.67 | 0 |
| 7.93 | 0.05 |
| 9.26 | 0.55 |

Step by stepSolved in 9 steps

Knowledge Booster

Similar questions
- A test of hypothesis is conducted to determine if the yields from a type of fruit tree were less than the expected 150 pounds per tree. They want to be 90% confident of their results. The computed z-score was 2.37. Find the p-value using a left-tailed test of hypothesis and state the decision. Show what value you are comparing the p-value toarrow_forwarduse the appropr Given are five observations collected in a regression study on two variables. may Yi 2 6 9 13 20 9 19 7 26 21 Die or X to 2.44 X to 29.82 Develop the 95% confidence and prediction intervals when x = 10. (Round your answers to two decimal places.) confidence interval -1.04 prediction interval -11.02 hnology to answer this yu XXarrow_forwardResearchers wanted to know if therapy could help smokers quit smoking. Of the 71 smokers they tested, 39 were smoking one year after treatment. Use a 0.05 significance level to test the claim that the majority are smoking one year after treatment. What is/are the critical value(s)? ттT Arial 3 (12pt) v TE -E · -arrow_forward
- Construct a 95% confidence interval for μ1−μ2 with the sample statistics for mean calorie content of two bakeries' specialty pies and confidence interval construction formula below. Assume the populations are approximately normal with equal variances.arrow_forwardSuppose that a researcher, using data on 150 randomly selected bicycles, estimates the OLS regression: Price=672.65-2.12x Weight, (185.8) (0.42) where Price measures the price of the th bike in dollars and Weight measures the weight of the th bike in kilograms. The 99% confidence interval for the intercept, ßo, will be (, ). (Round your answers to two decimal places.)arrow_forwardConstruct a 99% confidence interval for u, - H, with the sample statistics for mean cholesterol content of a hamburger from two fast food chains and confidence interval construction formula below. Assume the populations are approximately normal with unequal variances Stats X, = 98 mg, s,= 3.81 mg, n, = 14 x = 65 mg, s, =222 mg, n, =20 Confidence interval when variances are not equal +t. n2 d.f. is the smaller of n, - 1 or n, - 1 Enter the endpoints of the intervalarrow_forward
- the data support the claim that the average ACT composite score of students from this students is randomly selected from a local high school with an X = 23 and s = 5.2. Do ACT composite scores are normally distributed with a u = 21. A sample of 25 students is randomly selected from a local high school with an X= 23 and s =5.L.D high school is different than 21 on the ACT composite score, using x = .05?arrow_forwardq7arrow_forward
arrow_back_ios
arrow_forward_ios
Recommended textbooks for you
- MATLAB: An Introduction with ApplicationsStatisticsISBN:9781119256830Author:Amos GilatPublisher:John Wiley & Sons Inc
 Probability and Statistics for Engineering and th...StatisticsISBN:9781305251809Author:Jay L. DevorePublisher:Cengage Learning
 Statistics for The Behavioral Sciences (MindTap C...StatisticsISBN:9781305504912Author:Frederick J Gravetter, Larry B. WallnauPublisher:Cengage Learning
  Elementary Statistics: Picturing the World (7th E...StatisticsISBN:9780134683416Author:Ron Larson, Betsy FarberPublisher:PEARSON
 The Basic Practice of StatisticsStatisticsISBN:9781319042578Author:David S. Moore, William I. Notz, Michael A. FlignerPublisher:W. H. Freeman
 Introduction to the Practice of StatisticsStatisticsISBN:9781319013387Author:David S. Moore, George P. McCabe, Bruce A. CraigPublisher:W. H. Freeman
MATLAB: An Introduction with Applications
Statistics
ISBN:9781119256830
Author:Amos Gilat
Publisher:John Wiley & Sons Inc
Probability and Statistics for Engineering and th...
Statistics
ISBN:9781305251809
Author:Jay L. Devore
Publisher:Cengage Learning
Statistics for The Behavioral Sciences (MindTap C...
Statistics
ISBN:9781305504912
Author:Frederick J Gravetter, Larry B. Wallnau
Publisher:Cengage Learning
Elementary Statistics: Picturing the World (7th E...
Statistics
ISBN:9780134683416
Author:Ron Larson, Betsy Farber
Publisher:PEARSON
The Basic Practice of Statistics
Statistics
ISBN:9781319042578
Author:David S. Moore, William I. Notz, Michael A. Fligner
Publisher:W. H. Freeman
Introduction to the Practice of Statistics
Statistics
ISBN:9781319013387
Author:David S. Moore, George P. McCabe, Bruce A. Craig
Publisher:W. H. Freeman