Algebra and Trigonometry (6th Edition)
6th Edition
ISBN: 9780134463216
Author: Robert F. Blitzer
Publisher: PEARSON
expand_more
expand_more
format_list_bulleted
Question
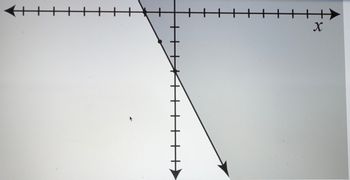
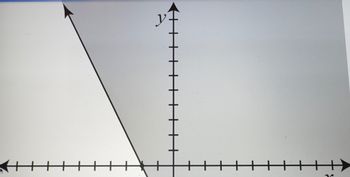
Identify the equation of the graph.
Answer options are:
1. y is greater than or equal to -2x-4
2. y is less than or equal to (1/2)x-4
3. y is less than or equal to 2x-4
4. y is greater than or equal to -(1/2)x-4

Transcribed Image Text:The provided image displays a two-dimensional graph with a line plotted on a Cartesian coordinate system. Below is a detailed explanation suitable for an educational website:
### Graph Description
- **Axes:**
- The horizontal axis is labeled as the x-axis.
- Both axes consist of evenly spaced intervals marked by short, perpendicular lines.
- **Line:**
- A diagonal line runs through the graph, extending from the upper left quadrant towards the lower right.
- The line appears to be linear, indicating a constant rate of change.
- **Coordinates and Intersections:**
- The line crosses the y-axis between the origin and the first grid line above it.
- It intersects the x-axis at the negative side, indicating a negative slope.
- **Appearance:**
- The line is displayed with arrows on both ends, signifying it continues indefinitely in both directions.
### Analytical Observations
- The line's negative slope suggests that as the value of x increases, the value of y decreases.
- Understanding the position where the line intersects both axes can help determine its equation and slope.
This visualization can aid in comprehending basic linear function properties, including slope and intercepts, which are fundamental concepts in algebra and coordinate geometry.

Transcribed Image Text:The image displays a coordinate plane featuring the x-axis and y-axis. The axes have arrows indicating the positive directions. The y-axis is labeled with the letter "y," while the x-axis is not visibly labeled.
A line with a negative slope moves diagonally downward from the top left to the bottom right, intersecting the y-axis near an upper point and moving towards the x-axis at the lower region, suggesting a line equation of form \(y = -mx + c\).
The graph is divided into two shaded regions: one is to the left of the line, and the other is to the right. The shading on the left is darker, indicating that this region might represent a particular solution set or inequality. The exact solution or inequality is not provided, and further context is required for precise interpretation.
Expert Solution
This question has been solved!
Explore an expertly crafted, step-by-step solution for a thorough understanding of key concepts.
Step by stepSolved in 3 steps with 6 images

Knowledge Booster
Similar questions
- Explain the graph of the equation x - 3y = 6 using a table of valuesarrow_forwardEvaluate (-0.5)(-7-1-7³-(-6)1) Select one: O a. -172 O b. -1221.5 O c. 172 O d. 1221.5 The graph of y--3x²+2x+2 is A C 9.arrow_forwardwhat the difference of y>2x-5 and y less than or equal to 2x-5? should i use a graph and just expalin it that way?arrow_forward
- Graph y = -2.5f (x + D +1arrow_forwardMatch the two graphs with two of the equations.arrow_forwardCallie has to spend at least $10 dollars on a bracelet for her best friend's birthday present. The bracelet costs $4 dollars and each charm costs $2. Which graph shows the number of charms Callie has to get on the bracelet for it to cost at least $10 dollars? 2343 D. ©2021 Iluminate EducationTM, Inc.arrow_forward
arrow_back_ios
arrow_forward_ios
Recommended textbooks for you
 Algebra and Trigonometry (6th Edition)AlgebraISBN:9780134463216Author:Robert F. BlitzerPublisher:PEARSON
 Contemporary Abstract AlgebraAlgebraISBN:9781305657960Author:Joseph GallianPublisher:Cengage Learning
 Linear Algebra: A Modern IntroductionAlgebraISBN:9781285463247Author:David PoolePublisher:Cengage Learning
 Algebra And Trigonometry (11th Edition)AlgebraISBN:9780135163078Author:Michael SullivanPublisher:PEARSON
 Introduction to Linear Algebra, Fifth EditionAlgebraISBN:9780980232776Author:Gilbert StrangPublisher:Wellesley-Cambridge Press
 College Algebra (Collegiate Math)AlgebraISBN:9780077836344Author:Julie Miller, Donna GerkenPublisher:McGraw-Hill Education

Algebra and Trigonometry (6th Edition)
Algebra
ISBN:9780134463216
Author:Robert F. Blitzer
Publisher:PEARSON

Contemporary Abstract Algebra
Algebra
ISBN:9781305657960
Author:Joseph Gallian
Publisher:Cengage Learning

Linear Algebra: A Modern Introduction
Algebra
ISBN:9781285463247
Author:David Poole
Publisher:Cengage Learning

Algebra And Trigonometry (11th Edition)
Algebra
ISBN:9780135163078
Author:Michael Sullivan
Publisher:PEARSON

Introduction to Linear Algebra, Fifth Edition
Algebra
ISBN:9780980232776
Author:Gilbert Strang
Publisher:Wellesley-Cambridge Press

College Algebra (Collegiate Math)
Algebra
ISBN:9780077836344
Author:Julie Miller, Donna Gerken
Publisher:McGraw-Hill Education