
Related questions
Concept explainers


Step by stepSolved in 2 steps

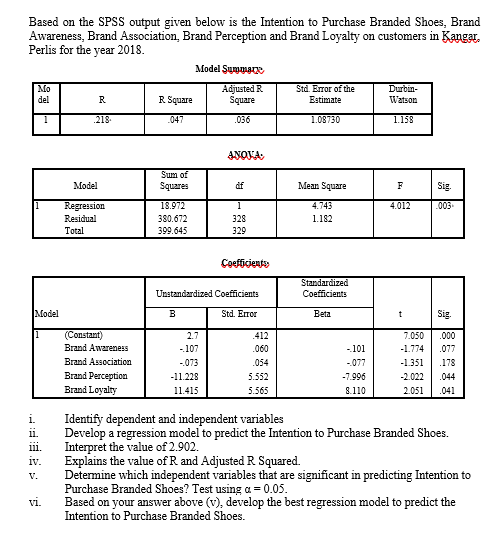
Based on the SPSS output given below is the Intention to Purchase Branded Shoes, Brand
Awareness, Brand Association, Brand Perception and Brand Loyalty on customers in Kangar,
Perlis for the year 2018.
Model Summaryb
Mo
del R R Square
Adjusted R
Square
Std. Error of the
Estimate
Durbin-
Watson
1 .218a
.047 .036 1.08730 1.158
ANOVAa
Model
Sum of
Squares df Mean Square F Sig.
1 Regression 18.972 1 4.743 4.012 .003b
Residual 380.672 328 1.182
Total 399.645 329
Coefficientsa
Model
Unstandardized Coefficients
Standardized
Coefficients
B Std. Error Beta t Sig.
1 (Constant) 2.7 .412 7.050 .000
Brand Awareness -.107 .060 -.101 -1.774 .077
Brand Association -.073 .054 -.077 -1.351 .178
Brand Perception -11.228 5.552 -7.996 -2.022 .044
Brand Loyalty 11.415 5.565 8.110 2.051 .041
i. Identify dependent and independent variables
ii. Develop a regression model to predict the Intention to Purchase Branded Shoes.
iii. Interpret the value of 2.902.
iv. Explains the value of R and Adjusted R Squared.
v. Determine which independent variables that are significant in predicting Intention to
Purchase Branded Shoes? Test using α = 0.05.
vi. Based on your answer above (v), develop the best regression model to predict the


- Test for the overall significance of the model. Use =0.05. Report the F-test statistic. Round to two decimal places.arrow_forwardWhat is the regression equation? (Round to decimal one) The best predicted weight of a bear with a chest size 43 inches is how many pounds???? Round to decimal one)arrow_forwardInterpret the estimated R2 Does the residual plot suggest that the fitted regression line is inappropriate for these data? Explain why or why not. Suppose that a new subject is added to the study data and that subject is 12.5 years old with an ATST of 580 minutes. If the regression model were to be refit with this additional data point, would the new slope be greater than or less than -14.041? Justify your response.arrow_forward
- Use the value of the linear correlation coefficient to calculate the coefficient of determination. What does this tell you about the explained variation of the data about the regression line? About the unexplained variation? r= -0.438 please dont copy paste the content from other sitesarrow_forwardThe data show the chest size and weight of several bears. Find the regression equation, letting chest size be the independent (x) variable. Then find the best predicted weight of a bear with a chest size of 41 inches. Is the result close to the actual weight of 153 pounds? Use a significance level of 0.05. Chest size (inches) Weight (pounds) Click the icon to view the critical values of the Pearson correlation coefficient r. 40 53 38 43 44 58 D 227 360 153 206 234 414 What is the regression equation? y=+x (Round to one decimal place as needed.) What is the best predicted weight of a bear with a chest size of 41 inches? The best predicted weight for a bear with a chest size of 41 inches is (Round to one decimal place as needed.) Is the result close to the actual weight of 153 pounds? O A. This result is exactly the same as the actual weight of the bear. O B. This result is close to the actual weight of the bear. O C. This result is very close to the actual weight of the bear. O D. This…arrow_forward2arrow_forward
- Prev The table below gives the list price and the number of bids received for five randomly selected items sold through online auctions. Using this data, consider the equation of the regression line, y = bo + b₁x, for predicting the number of bids an Item will receive based on the list price. Keep in mind, the correlation coefficient may or may not be statistically significant for the data given. Remember, In practice, It would not be appropriate to use the regression line to make a prediction if the correlation coefficient is not statistically significant. Price in Dollars 28 33 36 42 45 Number of Bids 1 7 8 9 10 Step 3 of 6: Find the estimated value of y when x = 33. Round your answer to three decimal places. Table Copy Data Nextarrow_forward2. Participants were kept awake for a certain number of hours before given a visuospatial task. Researchers measured how many correct responses each participant had. Results are shown below. Use alpha = .01. Number of Correct Hours Kept Awake (X) Responses (Y) 21 X = 10 SS, = 422 Y = 10 SS, = 690 2 4 19 %3D 6. 13 SPxy =-525 ху 5 20 S, =5.70 S, = 7.29 9. 11 10 9. 14 5 15 5 17 2 18 1 17 1 13 4 18 8 11 A. Graph the data. B. State the hypotheses. C. Make a decision about the null. a. Calculate Pearson's r i. Decision about null hypothesis? b. Calculate effect size i. Interpret effect size. D. State your conclusion. E. Relate your conclusion to the research. F. Calculate the regression formula. G. If someone was kept awake for 9 hours, what is the predicted number of correct responses?arrow_forwardPlease assist second part? Thank you!arrow_forward
- please answer for what is the p valuearrow_forwardBelow table contains a data sample where X is the independent, and Y the dependent variable. Using the data, please conduct a regression analysis. Determine first the regression equation with the help of below graph and table, then answer all the questions. 1. The value of cell a is 2. The value of cell b is 3: The value of cell c is 4: The value of cell d is 5: The value of cell e is 6: The value of cell f is 7: The value of cell g is 8. The value of cell h is 9: The value of cell i is 10: The value of cell j is 11: The value of cell k is 12: The value of cell l is 13: The value of cell m is 14: The value of cell n is 15: The value of cell o is 16: The value of cell p is 17: The value of cell q is 18: The value of cell r is 19: The value of cell s is 20: The value of cell t is 21: The value of cell u is 22: The value of cell v is 23: The value of cell w is 24: The value of cell x is 25: The value of cell y is 26: The value of cell z is 27: The value of cell aa is 28: The value of cell…arrow_forward
- MATLAB: An Introduction with ApplicationsStatisticsISBN:9781119256830Author:Amos GilatPublisher:John Wiley & Sons Inc
 Probability and Statistics for Engineering and th...StatisticsISBN:9781305251809Author:Jay L. DevorePublisher:Cengage Learning
 Statistics for The Behavioral Sciences (MindTap C...StatisticsISBN:9781305504912Author:Frederick J Gravetter, Larry B. WallnauPublisher:Cengage Learning
  Elementary Statistics: Picturing the World (7th E...StatisticsISBN:9780134683416Author:Ron Larson, Betsy FarberPublisher:PEARSON
 The Basic Practice of StatisticsStatisticsISBN:9781319042578Author:David S. Moore, William I. Notz, Michael A. FlignerPublisher:W. H. Freeman
 Introduction to the Practice of StatisticsStatisticsISBN:9781319013387Author:David S. Moore, George P. McCabe, Bruce A. CraigPublisher:W. H. Freeman