
MATLAB: An Introduction with Applications
6th Edition
ISBN: 9781119256830
Author: Amos Gilat
Publisher: John Wiley & Sons Inc
expand_more
expand_more
format_list_bulleted
Related questions
Concept explainers
Question
ANSWER THE NEEDED QUESTIONS FOR ALL THE QUESTIONS ANSWER CORRECTLY AND SHOW SOME SCREENSHOTS IN EXCEL AS SAID IN THE INSTRUCTIONS.

Transcribed Image Text:II.
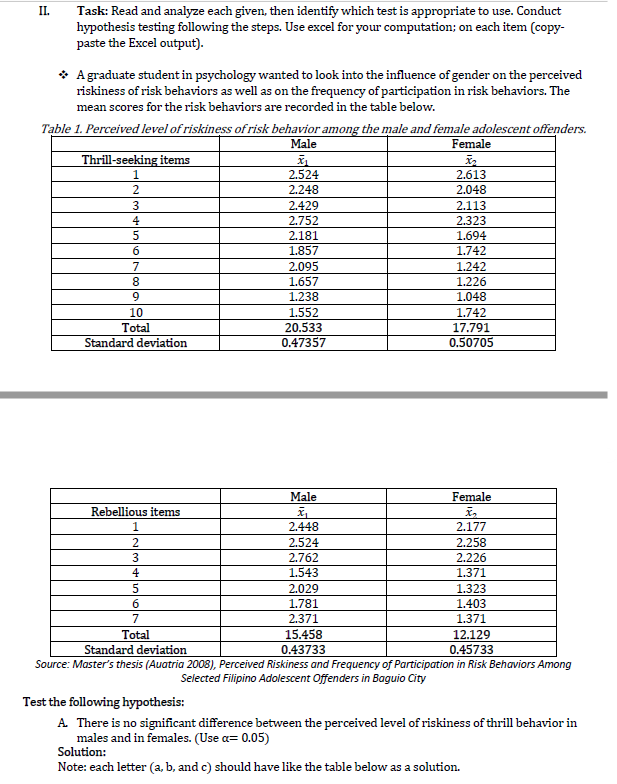
Task: Read and analyze each given, then identify which test is appropriate to use. Conduct
hypothesis testing following the steps. Use excel for your computation; on each item (copy-
paste the Excel output).
* Agraduate student in psychology wanted to look into the influence of gender on the perceived
riskiness of risk behaviors as well as on the frequency of participation in risk behaviors. The
mean scores for the risk behaviors are recorded in the table below.
Table 1. Perceived level of riskiness of risk behavior among the male and female adolescent offenders.
Male
Female
Thrill-seeking items
1
2.524
2.613
2
2.248
2.048
3
2.429
2.113
4
2.752
2.323
2.181
1.694
6
1.857
1.742
7
2.095
1.242
8
1.657
1.226
1.238
1.048
1.552
20.533
0.47357
10
1.742
Total
17.791
Standard deviation
0.50705
Male
Female
Rebellious items
2.448
2.177
2.524
2.258
2.226
3
2.762
1.543
4
1.371
2.029
1.323
6
1.781
1.403
7
2.371
1.371
Total
15.458
12.129
0.43733
Source: Master's thesis (Auatria 2008), Perceived Riskiness and Frequency of Participation in Risk Behaviors Among
Selected Filipino Adolescent Offenders in Baguio City
Standard deviation
0.45733
Test the following hypothesis:
A. There is no significant difference between the perceived level of riskiness of thrill behavior in
males and in females. (Use a= 0.05)
Solution:
Note: each letter (a, b, and c) should have like the table below as a solution.

Transcribed Image Text:2
4
Just copy the computed value form your excel output.
5
6.
Documentation: Screenshot your excel output showing the whole result and your name like the
example below: (1 screen shot only)
REGIONS1 - Ercel
Sly ivon
view
view
Helo
P Search
H
K.
M
N
t-Test: Two-Sample Asuming Equal Variances
78
75
82.07692 B6.15385
Variance 72.24359 20.B0769
Mean
Observati
13
13
Or
Delacruz, van STEM W PT2 - Saved
Page Layout
P Search
Formulas
Data
Review
View
Help
21 HE Clear
Reapply
DQueries & Connections
E Properties
Edit Links
I Sert
Stocks
Geography
Filter
Text to
Advanced
Columne E -
series & Connections
Data Types
Sort & Filter
Data Tooks
D
G
rivate public
3.00
75.00
5.00
79.00
t-Test: Two-Sample Assuming Equal variances
+.00
85.00
5.00
90.00
75
7.00
89.00
Mean
82.07692 86.15385
B. There is no significant difference between the perceived level of riskiness of rebellious
behavior in males and in females. (Use a= 0.10) -
> Do the same solution and documentation like in letter A.
C. There is no significant difference between the level of riskiness of thrill-seeking items and
rebellious items as perceived by the males. (Use a= 0.05).
> Do the same solution and documentation like in letter A.
Expert Solution
This question has been solved!
Explore an expertly crafted, step-by-step solution for a thorough understanding of key concepts.

Step by stepSolved in 2 steps with 33 images

Knowledge Booster


Learn more about
Need a deep-dive on the concept behind this application? Look no further. Learn more about this topic, statistics and related others by exploring similar questions and additional content below.Similar questions
arrow_back_ios
arrow_forward_ios
Recommended textbooks for you
- MATLAB: An Introduction with ApplicationsStatisticsISBN:9781119256830Author:Amos GilatPublisher:John Wiley & Sons Inc
 Probability and Statistics for Engineering and th...StatisticsISBN:9781305251809Author:Jay L. DevorePublisher:Cengage Learning
 Statistics for The Behavioral Sciences (MindTap C...StatisticsISBN:9781305504912Author:Frederick J Gravetter, Larry B. WallnauPublisher:Cengage Learning
  Elementary Statistics: Picturing the World (7th E...StatisticsISBN:9780134683416Author:Ron Larson, Betsy FarberPublisher:PEARSON
 The Basic Practice of StatisticsStatisticsISBN:9781319042578Author:David S. Moore, William I. Notz, Michael A. FlignerPublisher:W. H. Freeman
 Introduction to the Practice of StatisticsStatisticsISBN:9781319013387Author:David S. Moore, George P. McCabe, Bruce A. CraigPublisher:W. H. Freeman
MATLAB: An Introduction with Applications
Statistics
ISBN:9781119256830
Author:Amos Gilat
Publisher:John Wiley & Sons Inc
Probability and Statistics for Engineering and th...
Statistics
ISBN:9781305251809
Author:Jay L. Devore
Publisher:Cengage Learning
Statistics for The Behavioral Sciences (MindTap C...
Statistics
ISBN:9781305504912
Author:Frederick J Gravetter, Larry B. Wallnau
Publisher:Cengage Learning
Elementary Statistics: Picturing the World (7th E...
Statistics
ISBN:9780134683416
Author:Ron Larson, Betsy Farber
Publisher:PEARSON
The Basic Practice of Statistics
Statistics
ISBN:9781319042578
Author:David S. Moore, William I. Notz, Michael A. Fligner
Publisher:W. H. Freeman
Introduction to the Practice of Statistics
Statistics
ISBN:9781319013387
Author:David S. Moore, George P. McCabe, Bruce A. Craig
Publisher:W. H. Freeman