
MATLAB: An Introduction with Applications
6th Edition
ISBN: 9781119256830
Author: Amos Gilat
Publisher: John Wiley & Sons Inc
expand_more
expand_more
format_list_bulleted
Related questions
Question
Please answer the subparts.
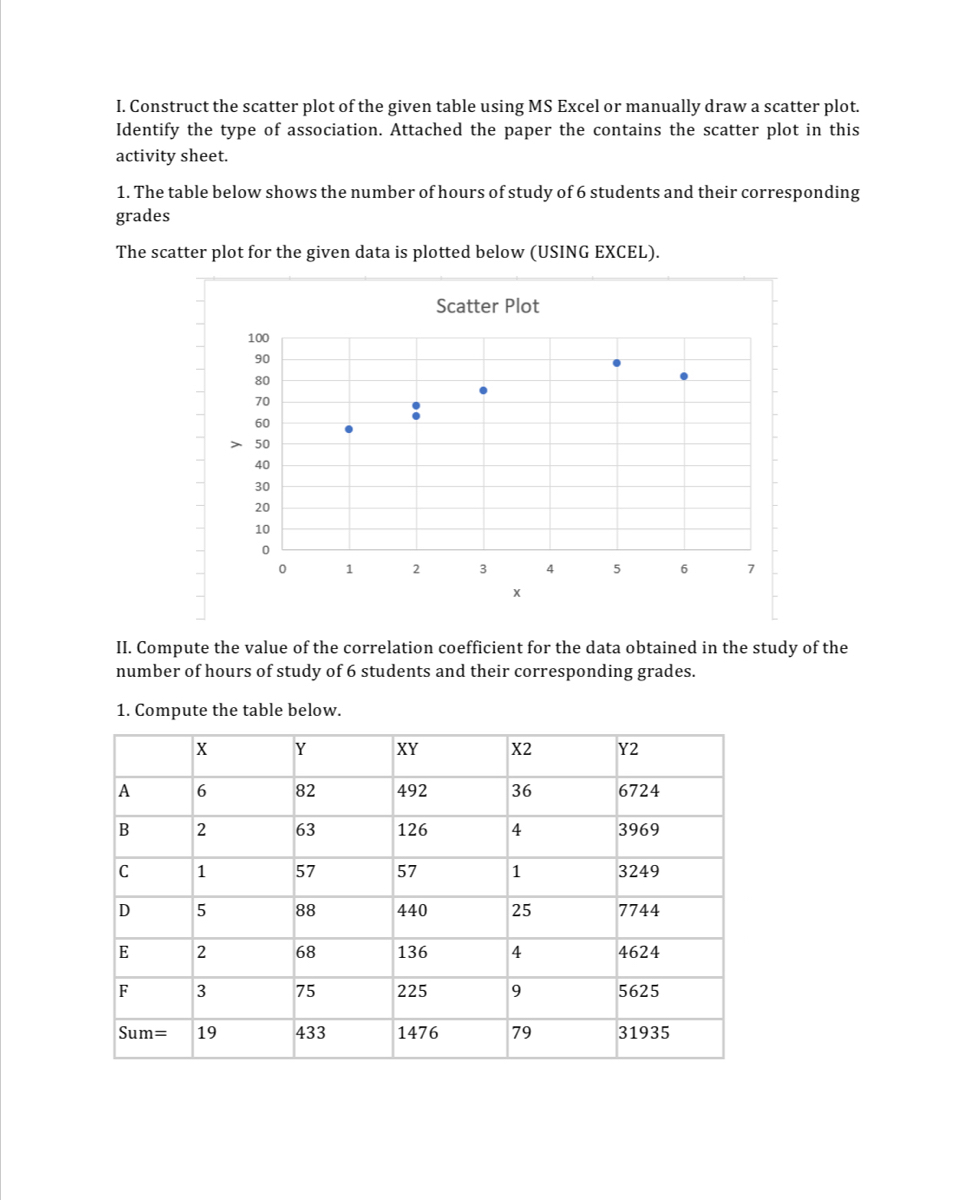

Transcribed Image Text:I. Construct the scatter plot of the given table using MS Excel or manually draw a scatter plot.
Identify the type of association. Attached the paper the contains the scatter plot in this
activity sheet.
1. The table below shows the number of hours of study of 6 students and their corresponding
grades
The scatter plot for the given data is plotted below (USING EXCEL).
A
B
C
D
E
F
Sum=
X
6
2
1
5
2
3
100
90
80
70
60
> 50
40
30
20
10
0
II. Compute the value of the correlation coefficient for the data obtained in the study of the
number of hours of study of 6 students and their corresponding grades.
1. Compute the table below.
19
0
Y
82
63
57
88
68
75
●
433
1
2
XY
492
126
57
440
136
Scatter Plot
225
3
1476
X2
36
4
1
25
4
9
4
79
●
5
Y2
6724
3969
3249
7744
4624
5625
6
31935
7

Transcribed Image Text:I. Construct the scatter plot of the given table using MS Excel or manually draw a scatter plot.
Identify the type of association. Attached the paper the contains the scatter plot in this activity
sheet.
1. The table below shows the number of hours of study of 6 students and their corresponding grades
Student Hours of Study (X) Grade (V)
A
6
82
B
C
D
A
B
C
D
E
F
II. Compute the value of the correlation coefficient for the data obtained in the study of the number
of hours of study of 6 students and their corresponding grades.
1. Compute the table below.
X
2. Find the values of the following:
a. n
b. ΣX=
c. ΣY =
d. ΣXY =
c. EX² =
f. ΣY² ==
2
1
5
2
3
63
57
88
68
75
XY
3. Interpret the value of Pearson product moment correlation coefficient or Pearson r.
Expert Solution
This question has been solved!
Explore an expertly crafted, step-by-step solution for a thorough understanding of key concepts.

This is a popular solution

Trending nowThis is a popular solution!

Step by stepSolved in 2 steps with 2 images

Knowledge Booster

Similar questions
arrow_back_ios
arrow_forward_ios
Recommended textbooks for you
- MATLAB: An Introduction with ApplicationsStatisticsISBN:9781119256830Author:Amos GilatPublisher:John Wiley & Sons Inc
 Probability and Statistics for Engineering and th...StatisticsISBN:9781305251809Author:Jay L. DevorePublisher:Cengage Learning
 Statistics for The Behavioral Sciences (MindTap C...StatisticsISBN:9781305504912Author:Frederick J Gravetter, Larry B. WallnauPublisher:Cengage Learning
  Elementary Statistics: Picturing the World (7th E...StatisticsISBN:9780134683416Author:Ron Larson, Betsy FarberPublisher:PEARSON
 The Basic Practice of StatisticsStatisticsISBN:9781319042578Author:David S. Moore, William I. Notz, Michael A. FlignerPublisher:W. H. Freeman
 Introduction to the Practice of StatisticsStatisticsISBN:9781319013387Author:David S. Moore, George P. McCabe, Bruce A. CraigPublisher:W. H. Freeman
MATLAB: An Introduction with Applications
Statistics
ISBN:9781119256830
Author:Amos Gilat
Publisher:John Wiley & Sons Inc
Probability and Statistics for Engineering and th...
Statistics
ISBN:9781305251809
Author:Jay L. Devore
Publisher:Cengage Learning
Statistics for The Behavioral Sciences (MindTap C...
Statistics
ISBN:9781305504912
Author:Frederick J Gravetter, Larry B. Wallnau
Publisher:Cengage Learning
Elementary Statistics: Picturing the World (7th E...
Statistics
ISBN:9780134683416
Author:Ron Larson, Betsy Farber
Publisher:PEARSON
The Basic Practice of Statistics
Statistics
ISBN:9781319042578
Author:David S. Moore, William I. Notz, Michael A. Fligner
Publisher:W. H. Freeman
Introduction to the Practice of Statistics
Statistics
ISBN:9781319013387
Author:David S. Moore, George P. McCabe, Bruce A. Craig
Publisher:W. H. Freeman