MATLAB: An Introduction with Applications
6th Edition
ISBN: 9781119256830
Author: Amos Gilat
Publisher: John Wiley & Sons Inc
expand_more
expand_more
format_list_bulleted
Concept explainers
Question
I want all the choices (a, b, c, d) solved

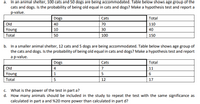
Transcribed Image Text:a. In an animal shelter, 100 cats and 50 dogs are being accommodated. Table below shows age group of the
cats and dogs. Is the probability of being old equal in cats and dogs? Make a hypothesis test and report a
p-value.
Dogs
Cats
Total
Old
40
70
110
Young
10
30
40
Total
50
100
150
b. In a smaller animal shelter, 12 cats and 5 dogs are being accommodated. Table below shows age group of
the cats and dogs. Is the probability of being old equal in cats and dogs? Make a hypothesis test and report
a p-value.
Dogs
Cats
Total
Old
4
7
11
Young
5
Total
12
17
c. What is the power of the test in part a?
d. How many animals should be included in the study to repeat the test with the same significance as
calculated in part a and %20 more power than calculated in part d?
Expert Solution
This question has been solved!
Explore an expertly crafted, step-by-step solution for a thorough understanding of key concepts.
Step by stepSolved in 4 steps with 6 images

Knowledge Booster
Learn more about
Need a deep-dive on the concept behind this application? Look no further. Learn more about this topic, statistics and related others by exploring similar questions and additional content below.Similar questions
- A survey of 1900 commuters in New York City showed that 1180 take the subway, 650 take the bus, and 170 do not take either the bus or the subway. (a) How many commuters take both the bus and the subway?(b) How many commuters take only the subway?arrow_forwardIf n(A) = 46, n(B) = 19, and n(An B) = 8, find n(A u B).arrow_forwardFind the following: (A U B) n C A={4,5,6}, B={4,6,8} and C={6,7,8,9,10}arrow_forward
- A basketball team contains 3 freshmen and 5 sophomores. The players are asked to line-up for a team picture. The number of ways for the players to line-up is O a hp 144 40arrow_forwardOtto is a well-known street vendor who sells three flavors of ice cream and provides a choice of three toppings. His sales during the course of a given day are shown in the table below: Chocolate (A) Vanilla (B) Cherry (C) Plain (D) 125 70 30 Sprinkles (E) 75 25 10 Nuts (F) 50 55 60 From the above table find a. P(B and C) b. P(A or C or D)arrow_forwardIf n(A) = 64, n(B) = 18, and n(AN B) = 7, find n(A U B).arrow_forward
arrow_back_ios
arrow_forward_ios
Recommended textbooks for you
 MATLAB: An Introduction with ApplicationsStatisticsISBN:9781119256830Author:Amos GilatPublisher:John Wiley & Sons Inc
 Probability and Statistics for Engineering and th...StatisticsISBN:9781305251809Author:Jay L. DevorePublisher:Cengage Learning
 Statistics for The Behavioral Sciences (MindTap C...StatisticsISBN:9781305504912Author:Frederick J Gravetter, Larry B. WallnauPublisher:Cengage Learning
 Elementary Statistics: Picturing the World (7th E...StatisticsISBN:9780134683416Author:Ron Larson, Betsy FarberPublisher:PEARSON
 The Basic Practice of StatisticsStatisticsISBN:9781319042578Author:David S. Moore, William I. Notz, Michael A. FlignerPublisher:W. H. Freeman
 Introduction to the Practice of StatisticsStatisticsISBN:9781319013387Author:David S. Moore, George P. McCabe, Bruce A. CraigPublisher:W. H. Freeman

MATLAB: An Introduction with Applications
Statistics
ISBN:9781119256830
Author:Amos Gilat
Publisher:John Wiley & Sons Inc

Probability and Statistics for Engineering and th...
Statistics
ISBN:9781305251809
Author:Jay L. Devore
Publisher:Cengage Learning

Statistics for The Behavioral Sciences (MindTap C...
Statistics
ISBN:9781305504912
Author:Frederick J Gravetter, Larry B. Wallnau
Publisher:Cengage Learning

Elementary Statistics: Picturing the World (7th E...
Statistics
ISBN:9780134683416
Author:Ron Larson, Betsy Farber
Publisher:PEARSON

The Basic Practice of Statistics
Statistics
ISBN:9781319042578
Author:David S. Moore, William I. Notz, Michael A. Fligner
Publisher:W. H. Freeman

Introduction to the Practice of Statistics
Statistics
ISBN:9781319013387
Author:David S. Moore, George P. McCabe, Bruce A. Craig
Publisher:W. H. Freeman