MATLAB: An Introduction with Applications
6th Edition
ISBN: 9781119256830
Author: Amos Gilat
Publisher: John Wiley & Sons Inc
expand_more
expand_more
format_list_bulleted
Question
I need help with part b, c and d

Transcribed Image Text:1.32
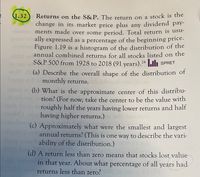
Returns on the S&P. The return on a stock is the
change in its market price plus any dividend pay-
omen ments made over some period. Total return is usu-
ally expressed as a percentage of the beginning price.
Figure 1.19 is a histogram of the distribution of the
annual combined returns for all stocks listed on the
S&P 500 from 1928 to 2018 (91 years).24uli SPRET
woh
(a) Describe the overall shape of the distribution of
rairh monthly returns. ib uoy bluow
s ni (b) What is the approximate center of this distribu-
ubong o tion? (For now, take the center to be the value with
1ed eroughly half the years having lower returns and half
u having higher returns.)
(c) Approximately what were the smallest and largest
annual returns? (This is one way to describe the vari-
ability of the distribution.)
(d) A return less than zero means that stocks lost value
in that year. About what percentage of all years had
returns less than zero?

Transcribed Image Text:13 0z
2. Are you right-handed or left-handed? (In
right = 0, left = 1.)
3. What is your height, in inches?
13
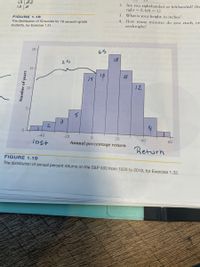
FIGURE 1.18
The distribution of IQ scores for 78 seventh-grade
4. How many minutes do you study om
weeknight?
students, for Exercise 1.31.
20-
65
18
2ら
12
3.
0-
-40
-20
20
Annual percentage return
lost
40
60
Return
FIGURE 1.19
The distribution of annual percent returns on the S&P 500 from 1928 to 2018, for Exercise 1.32.
Number of years
Expert Solution
This question has been solved!
Explore an expertly crafted, step-by-step solution for a thorough understanding of key concepts.
This is a popular solution
Trending nowThis is a popular solution!
Step by stepSolved in 2 steps with 2 images

Knowledge Booster
Similar questions
- Answer urgently please !!! Show all workingarrow_forwardFind B, a, and c .arrow_forwardFor following function, select (on the same set of coordinate axes) a graph of function for c = 3, 1 and–3. [x²+c,x<0 -x2+c, x20 f(x) = -5 -4 -3 -2\-1. 5 3 4 2+ -3 2 + -5 -4 -3 -2 + 3 4 5 1 2 -2 -3 -5arrow_forward
arrow_back_ios
arrow_forward_ios
Recommended textbooks for you
 MATLAB: An Introduction with ApplicationsStatisticsISBN:9781119256830Author:Amos GilatPublisher:John Wiley & Sons Inc
 Probability and Statistics for Engineering and th...StatisticsISBN:9781305251809Author:Jay L. DevorePublisher:Cengage Learning
 Statistics for The Behavioral Sciences (MindTap C...StatisticsISBN:9781305504912Author:Frederick J Gravetter, Larry B. WallnauPublisher:Cengage Learning
 Elementary Statistics: Picturing the World (7th E...StatisticsISBN:9780134683416Author:Ron Larson, Betsy FarberPublisher:PEARSON
 The Basic Practice of StatisticsStatisticsISBN:9781319042578Author:David S. Moore, William I. Notz, Michael A. FlignerPublisher:W. H. Freeman
 Introduction to the Practice of StatisticsStatisticsISBN:9781319013387Author:David S. Moore, George P. McCabe, Bruce A. CraigPublisher:W. H. Freeman

MATLAB: An Introduction with Applications
Statistics
ISBN:9781119256830
Author:Amos Gilat
Publisher:John Wiley & Sons Inc

Probability and Statistics for Engineering and th...
Statistics
ISBN:9781305251809
Author:Jay L. Devore
Publisher:Cengage Learning

Statistics for The Behavioral Sciences (MindTap C...
Statistics
ISBN:9781305504912
Author:Frederick J Gravetter, Larry B. Wallnau
Publisher:Cengage Learning

Elementary Statistics: Picturing the World (7th E...
Statistics
ISBN:9780134683416
Author:Ron Larson, Betsy Farber
Publisher:PEARSON

The Basic Practice of Statistics
Statistics
ISBN:9781319042578
Author:David S. Moore, William I. Notz, Michael A. Fligner
Publisher:W. H. Freeman

Introduction to the Practice of Statistics
Statistics
ISBN:9781319013387
Author:David S. Moore, George P. McCabe, Bruce A. Craig
Publisher:W. H. Freeman