MATLAB: An Introduction with Applications
6th Edition
ISBN: 9781119256830
Author: Amos Gilat
Publisher: John Wiley & Sons Inc
expand_more
expand_more
format_list_bulleted
Question
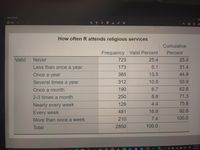
I need help filling in the following blanks based on the attached table:
The 36th percentile is [Blank]. That means [Blank] percent of people in the same area attend [Blank] or less frequently.
The 65th percentile is [Blank]. That means [Blank] percent of people in the same area attend [Blank] or less frequently. frequently.

Transcribed Image Text:Snip & Sketch
O New
How often R attends religious services
Cumulative
Frequency Valid Percent
Percent
Valid
Never
723
25.4
25.4
Less than once a year
173
6.1
31.4
Once a year
385
13.5
44.9
Several times a year
312
10.9
55.9
Once a month
190
6.7
62.6
2-3 times a month
250
8.8
71.3
Nearly every week
126
4.4
75.8
Every week
481
16.9
92.6
More than once a week
210
7.4
100.0
Total
2850
100.0
8:37 PM
2/3/2022
Expert Solution
arrow_forward
Step 1
Introduction:
It is required to identify the 36th percentile and 65th percentile.
Step by stepSolved in 2 steps

Knowledge Booster
Similar questions
- A recent poll of 2940 corporate executives showed that the average price of their cars is $31,800 is this a population parameter or a sample statstic and why?arrow_forwardI need help with 5 a,b,carrow_forwardThe following are scores shot by a golf team in a 9-hole course: 46,52,47,54,55,43,53,48,51,41,50 find the mean, median, 1rst quartile and second quartile of these numbers.arrow_forward
- Based on the following data set: 150, 180,210,220,250,325 What would be the change to the mean, median, and mode if 325 is changed to 150. Mean Median Mode Original Changedarrow_forwardConsider the following data set:[36, 62, 18, 16, 63, 51, 50, 11]Determine the 10th percentile.arrow_forward......arrow_forward
- If a person’s z-score equalas 2.08, what is their percentile? Thank you.arrow_forwardEstimate the most likely degree of correlation for the scatterplot Options: a. 0 b. .85 c. -.90 d. -.05arrow_forwardQ2. The 30% trimmed mean of the following data (120, 150, 170, 177, 178, 181, 198, 250, 450, 955} is: *arrow_forward
- Find the mean for the following group of data items. 5, 1, 8, 3, 4, 2, 5, 9 The mean is 4.63. (Type an integer or a decimal.)arrow_forwardSuppose you are told your BMI is 32, the 70th percentile for your age and sex. Please interpret this percentile age: 28 Femalearrow_forwardThe 20 scores below were recorded from a math test: 75, 64, 82, 68, 75, 73, 68, 78, 80, 97, 85, 68, 62, 52, 77, 85, 90, 83, 68, 82 Using the 20 math score, neatly construct a relative frequency histogram.arrow_forward
arrow_back_ios
SEE MORE QUESTIONS
arrow_forward_ios
Recommended textbooks for you
 MATLAB: An Introduction with ApplicationsStatisticsISBN:9781119256830Author:Amos GilatPublisher:John Wiley & Sons Inc
 Probability and Statistics for Engineering and th...StatisticsISBN:9781305251809Author:Jay L. DevorePublisher:Cengage Learning
 Statistics for The Behavioral Sciences (MindTap C...StatisticsISBN:9781305504912Author:Frederick J Gravetter, Larry B. WallnauPublisher:Cengage Learning
 Elementary Statistics: Picturing the World (7th E...StatisticsISBN:9780134683416Author:Ron Larson, Betsy FarberPublisher:PEARSON
 The Basic Practice of StatisticsStatisticsISBN:9781319042578Author:David S. Moore, William I. Notz, Michael A. FlignerPublisher:W. H. Freeman
 Introduction to the Practice of StatisticsStatisticsISBN:9781319013387Author:David S. Moore, George P. McCabe, Bruce A. CraigPublisher:W. H. Freeman

MATLAB: An Introduction with Applications
Statistics
ISBN:9781119256830
Author:Amos Gilat
Publisher:John Wiley & Sons Inc

Probability and Statistics for Engineering and th...
Statistics
ISBN:9781305251809
Author:Jay L. Devore
Publisher:Cengage Learning

Statistics for The Behavioral Sciences (MindTap C...
Statistics
ISBN:9781305504912
Author:Frederick J Gravetter, Larry B. Wallnau
Publisher:Cengage Learning

Elementary Statistics: Picturing the World (7th E...
Statistics
ISBN:9780134683416
Author:Ron Larson, Betsy Farber
Publisher:PEARSON

The Basic Practice of Statistics
Statistics
ISBN:9781319042578
Author:David S. Moore, William I. Notz, Michael A. Fligner
Publisher:W. H. Freeman

Introduction to the Practice of Statistics
Statistics
ISBN:9781319013387
Author:David S. Moore, George P. McCabe, Bruce A. Craig
Publisher:W. H. Freeman