
MATLAB: An Introduction with Applications
6th Edition
ISBN: 9781119256830
Author: Amos Gilat
Publisher: John Wiley & Sons Inc
expand_more
expand_more
format_list_bulleted
Related questions
Question
thumb_up100%
I NEED ALL PARTS PLEASE
A (continued): null or alternative and what are h0 & ha
B. critical values and rejection region (rounded to three decimals)
places)
C.standardized test statistic (rounded to three decimal places)
D.reject or fail to reject
e.interpret the decision/conclusion
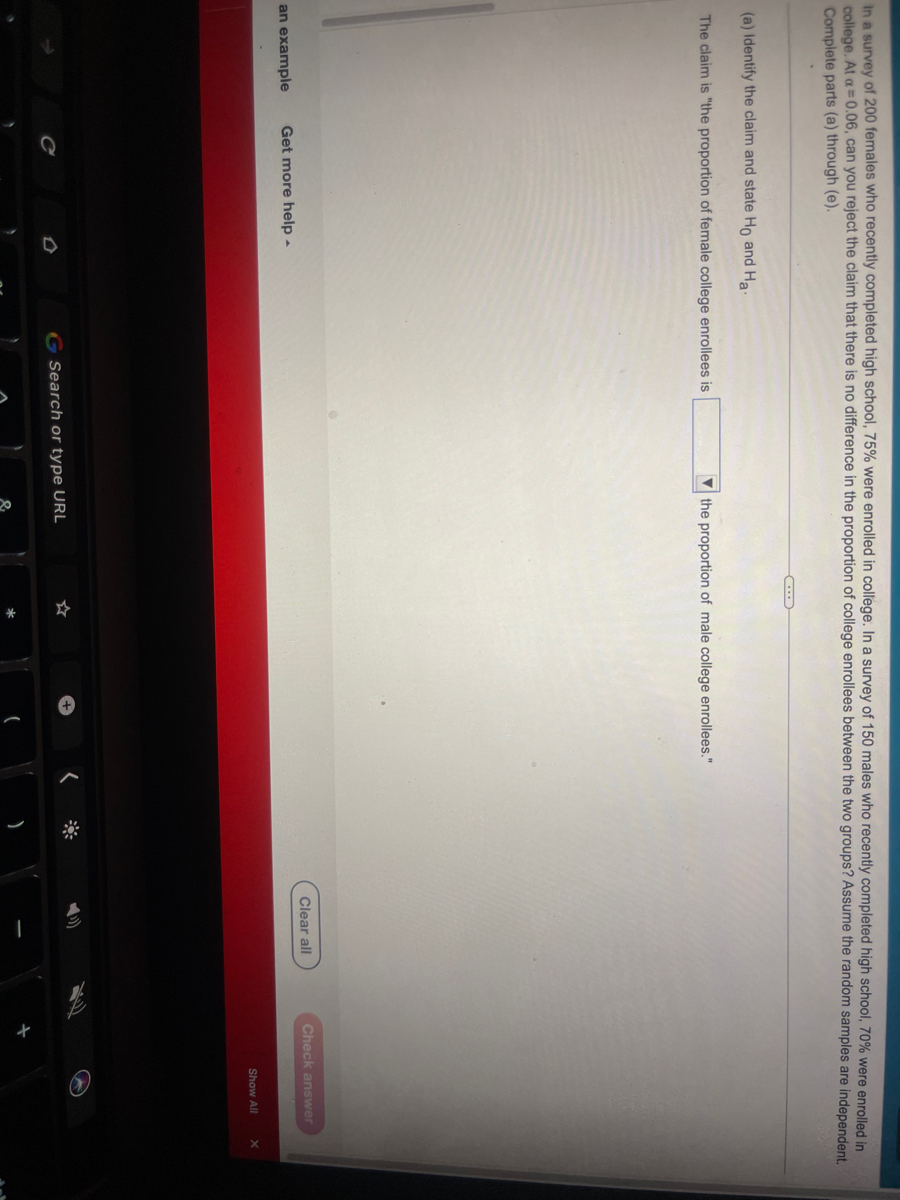

Transcribed Image Text:In a survey of 200 females who recently completed high school, 75% were enrolled in college. In a survey of 150 males who recently completed high school, 70% were enrolled in
college. At a = 0.06, can you reject the claim that there is no difference in the proportion of college enrollees between the two groups? Assume the random samples are independent.
Complete parts (a) through (e).
(a) Identify the claim and state Ho and Ha-
The claim is "the proportion of female college enrollees is
an example Get more help.
the proportion of male college enrollees."
G Search or type URL
Clear all
Check answer
Show All
Expert Solution
This question has been solved!
Explore an expertly crafted, step-by-step solution for a thorough understanding of key concepts.

Step by stepSolved in 4 steps with 3 images

Knowledge Booster

Similar questions
- No programming please. I don’t want a code as an answer.arrow_forwardYou want to compare differences in prior arrests across ethnicity in your study, you measured ethnicity as white =0 black =1 hispanic=2, and other =3. Prior arrests was recorded as the number of prior arrests. which test would you perform to see if arrests differ across diffrent ethnic categories? A. ANOVA B. T-testarrow_forwardPlease answer all parts. One question, This is not graded. it is practicearrow_forward
- 5. Which set of four test scores would have the biggest difference between the mean and the median? O A. 32, 85, 89, 91, 92, 92 O B. 72, 78, 79, 80, 82, 82 O C. 65, 70, 75, 80, 85, 90 O D. 30, 34, 39, 41, 48, 50arrow_forwardDetermine the mean of math proficiency scores of students taught by the Standard Method. Determine the median of math proficiency scores of students taught by the New Method. Determine the median of math proficiency scores of students taught by the Standard Method. Determine the mean of math proficiency scores of students taught by the New Method.arrow_forward
arrow_back_ios
arrow_forward_ios
Recommended textbooks for you
- MATLAB: An Introduction with ApplicationsStatisticsISBN:9781119256830Author:Amos GilatPublisher:John Wiley & Sons Inc
 Probability and Statistics for Engineering and th...StatisticsISBN:9781305251809Author:Jay L. DevorePublisher:Cengage Learning
 Statistics for The Behavioral Sciences (MindTap C...StatisticsISBN:9781305504912Author:Frederick J Gravetter, Larry B. WallnauPublisher:Cengage Learning
  Elementary Statistics: Picturing the World (7th E...StatisticsISBN:9780134683416Author:Ron Larson, Betsy FarberPublisher:PEARSON
 The Basic Practice of StatisticsStatisticsISBN:9781319042578Author:David S. Moore, William I. Notz, Michael A. FlignerPublisher:W. H. Freeman
 Introduction to the Practice of StatisticsStatisticsISBN:9781319013387Author:David S. Moore, George P. McCabe, Bruce A. CraigPublisher:W. H. Freeman
MATLAB: An Introduction with Applications
Statistics
ISBN:9781119256830
Author:Amos Gilat
Publisher:John Wiley & Sons Inc
Probability and Statistics for Engineering and th...
Statistics
ISBN:9781305251809
Author:Jay L. Devore
Publisher:Cengage Learning
Statistics for The Behavioral Sciences (MindTap C...
Statistics
ISBN:9781305504912
Author:Frederick J Gravetter, Larry B. Wallnau
Publisher:Cengage Learning
Elementary Statistics: Picturing the World (7th E...
Statistics
ISBN:9780134683416
Author:Ron Larson, Betsy Farber
Publisher:PEARSON
The Basic Practice of Statistics
Statistics
ISBN:9781319042578
Author:David S. Moore, William I. Notz, Michael A. Fligner
Publisher:W. H. Freeman
Introduction to the Practice of Statistics
Statistics
ISBN:9781319013387
Author:David S. Moore, George P. McCabe, Bruce A. Craig
Publisher:W. H. Freeman