
MATLAB: An Introduction with Applications
6th Edition
ISBN: 9781119256830
Author: Amos Gilat
Publisher: John Wiley & Sons Inc
expand_more
expand_more
format_list_bulleted
Related questions
Question
How will I draw this bar chart using R code?
X axis will be month, y axis will be the amount of immigrants.
Thanks.
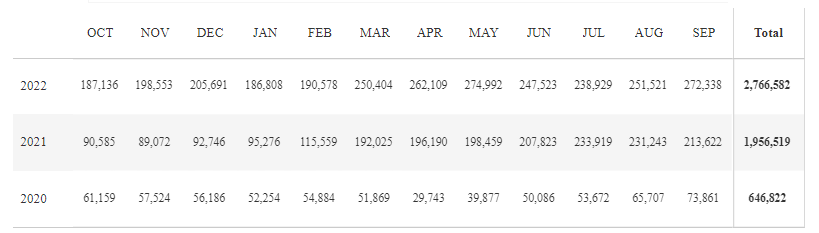

Transcribed Image Text:### Data Representation: Monthly Statistics Over Three Years
This table presents a comparison of monthly data across three consecutive years (2020, 2021, and 2022). Each row details monthly figures for the given year, ending with a total that reflects the sum for that year.
#### Monthly Data Breakdown:
- **2022**
- October: 187,136
- November: 198,553
- December: 205,691
- January: 186,808
- February: 190,578
- March: 250,404
- April: 262,109
- May: 274,992
- June: 247,523
- July: 238,929
- August: 251,521
- September: 272,338
- **Total**: 2,766,582
- **2021**
- October: 90,585
- November: 89,072
- December: 92,746
- January: 95,276
- February: 115,559
- March: 192,025
- April: 196,190
- May: 198,459
- June: 207,823
- July: 233,919
- August: 231,243
- September: 213,622
- **Total**: 1,956,519
- **2020**
- October: 61,159
- November: 57,524
- December: 56,186
- January: 52,254
- February: 54,884
- March: 51,869
- April: 29,743
- May: 39,377
- June: 50,086
- July: 53,672
- August: 65,707
- September: 73,861
- **Total**: 646,322
### Analysis:
The data illustrates a significant increase in totals over the three-year span, with 2022 having the highest figures each month compared to previous years. This upward trend may indicate growth or an increase in whatever the data is measuring. Notably, the month of May in 2022
Expert Solution
This question has been solved!
Explore an expertly crafted, step-by-step solution for a thorough understanding of key concepts.

This is a popular solution

Trending nowThis is a popular solution!

Step by stepSolved in 2 steps with 3 images

Knowledge Booster

Similar questions
- Emily is making two pizzas at home. For each pizza, she needs to prep the dough and put it intothe oven, which takes 8 minutes per pizza. In the oven, the pizza bakes for 6 minutes. Then,Emily takes the pizza out and slices it, which takes 2 minutes. The oven can only hold one pizzaat a time. How long will it take her to make the two pizzas? Please draw a Gantt chart to find thesolution.arrow_forwardLuis surveyed some middle school and high school students about the type of music they prefer. Complete the table. Preferred Music Grade Country Pop Other Total Middle School 17 11 28 High School 31 12 Totalarrow_forwardAlexa's parents are looking to put new carpet in their living room. They have received several different price quotes: $850,$625,$710,and $599. What is the average price quote Alexa's parents received? a $702 b $722 c $696 d $784arrow_forward
- A map of Levi’s trip is being made with a scale of 2 centimeters : 30 miles. How many centimeters will a 315 mile trip be on his map?arrow_forwardCLEAN laundry detergent costs $8.60 for 25 loads. FRESH laundry detergent costs $10.50 for 40 loads. Make two ratio tables to show cost and number of loads that are in the same ratios as the original detergents. Then decide which detergent is the better buy. Explain your choice referencing your ratio tables.arrow_forwardA basketball is approximately one-tenth the size of an inflated beachball. If the diameter of a basketball is 9.4 inches, what would be the diameter of an inflated beach ball? Use the place value chart to justify your answer.arrow_forward
- 320 is what percentage of 4arrow_forwardDescribe about Multiple Comparisons.arrow_forwardJack and Kevin are creating a mosaic for art class by using fragments of broken tiles. They want the mosaic to have 100 sections. If each section requires 31.5 tiles, how many tiles will they need to complete the mosaic? Explain your reasoning with a place value chart. evonarrow_forward
- My little sister owes my mom $10 right now, and she gets an allowance of $7 every week. She wants to buy a $15 Toy but she has to pay back my mom first. Model this story using motion on a number line.arrow_forwardThe distance between Boston and Chicago on a map is 9 inches. If the scale of the map is 1 inch : 95 miles, what is the actual distance from Boston to Chicago? The actual distance is miles. Pause test Back Nextarrow_forward
arrow_back_ios
arrow_forward_ios
Recommended textbooks for you
- MATLAB: An Introduction with ApplicationsStatisticsISBN:9781119256830Author:Amos GilatPublisher:John Wiley & Sons Inc
 Probability and Statistics for Engineering and th...StatisticsISBN:9781305251809Author:Jay L. DevorePublisher:Cengage Learning
 Statistics for The Behavioral Sciences (MindTap C...StatisticsISBN:9781305504912Author:Frederick J Gravetter, Larry B. WallnauPublisher:Cengage Learning
  Elementary Statistics: Picturing the World (7th E...StatisticsISBN:9780134683416Author:Ron Larson, Betsy FarberPublisher:PEARSON
 The Basic Practice of StatisticsStatisticsISBN:9781319042578Author:David S. Moore, William I. Notz, Michael A. FlignerPublisher:W. H. Freeman
 Introduction to the Practice of StatisticsStatisticsISBN:9781319013387Author:David S. Moore, George P. McCabe, Bruce A. CraigPublisher:W. H. Freeman
MATLAB: An Introduction with Applications
Statistics
ISBN:9781119256830
Author:Amos Gilat
Publisher:John Wiley & Sons Inc
Probability and Statistics for Engineering and th...
Statistics
ISBN:9781305251809
Author:Jay L. Devore
Publisher:Cengage Learning
Statistics for The Behavioral Sciences (MindTap C...
Statistics
ISBN:9781305504912
Author:Frederick J Gravetter, Larry B. Wallnau
Publisher:Cengage Learning
Elementary Statistics: Picturing the World (7th E...
Statistics
ISBN:9780134683416
Author:Ron Larson, Betsy Farber
Publisher:PEARSON
The Basic Practice of Statistics
Statistics
ISBN:9781319042578
Author:David S. Moore, William I. Notz, Michael A. Fligner
Publisher:W. H. Freeman
Introduction to the Practice of Statistics
Statistics
ISBN:9781319013387
Author:David S. Moore, George P. McCabe, Bruce A. Craig
Publisher:W. H. Freeman