MATLAB: An Introduction with Applications
6th Edition
ISBN: 9781119256830
Author: Amos Gilat
Publisher: John Wiley & Sons Inc
expand_more
expand_more
format_list_bulleted
Question
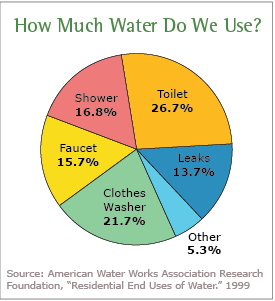
explain WHY this pie chart needs improving and HOW you would improve it.

Transcribed Image Text:How Much Water Do We Use?
Shower
16.8%
Faucet
15.7%
Clothes
Washer
21.7%
Toilet
26.7%
Leaks
13.7%
Other
5.3%
Source: American Water Works Association Research
Foundation, "Residential End Uses of Water." 1999
Expert Solution
This question has been solved!
Explore an expertly crafted, step-by-step solution for a thorough understanding of key concepts.
This is a popular solution
Trending nowThis is a popular solution!
Step by stepSolved in 2 steps with 1 images

Knowledge Booster
Similar questions
- How will I draw this line chart using the data shown in this picture using R code? Thanks.arrow_forwardWhat is the mean median and mode using this infoarrow_forwardI keep getting results (answers from you guys) saying that this is a histogram but I thought histograms had connecting bars. If it isn’t a histogram then what is it and does that type of graph best represent this data or would something else be better?arrow_forward
- General Social Survey (GSS) 2006 collected the data of the number of people in each household in the U.S. The variable name is "hompop."arrow_forwardIn a recent article you see a histogram graph that displayed the average number of hours teens get in a night. The graph is a form of what type of statistics? Descriptive or Inferentialarrow_forwardThe statistics prompt states "The average amount of sleep people get throughout the week in hours. You’ve collected data from 6 people." I need to know how I would input this data into SPSS, or at least what kind of graph it would be so I can try to break it down. Thank you.arrow_forward
- What is the measure of ∠x in this diagram?arrow_forwardUse the given minimum and maximum data entries, and the number of classes, to find the class width, the lower class limits, and the upper class limits. minimumequals=10, maximumequals=67, 66 classes Question content area bottom Part 1 The class width is enter your response here. Part 2 Choose the correct lower class limits below. A. 10, 20, 30, 40, 50, 60 B. 20, 29, 40, 50, 60, 69 C. 10, 19, 30, 39, 49, 60 D. 19, 29, 40, 49, 59, 69 Part 3 Choose the correct upper class limits below. A. 20, 30, 40, 50, 60, 69 B. 20, 30, 39, 49, 60, 69 C. 19, 29, 39, 49, 59, 69 D. 19, 29, 40, 50, 59, 69 The class width is.Choose the correct lower class limits below.Choose the correct upper class limits below.arrow_forwardShow your answers in the box below. Note: You do not have to show the steps, answers only is good! Consider the ranked data: 1, 1, 2, 3, 4, 5, 6, 7, 12, 15, 20, 22, 23, 25, 27, 31, 40. Find the five number Summary. Min, Q1, Q2, Q3, Max Edit View Insert Format Tools Table 12pt ✓ Paragraph BIUA & ✓ T²✓ :arrow_forward
arrow_back_ios
SEE MORE QUESTIONS
arrow_forward_ios
Recommended textbooks for you
 MATLAB: An Introduction with ApplicationsStatisticsISBN:9781119256830Author:Amos GilatPublisher:John Wiley & Sons Inc
 Probability and Statistics for Engineering and th...StatisticsISBN:9781305251809Author:Jay L. DevorePublisher:Cengage Learning
 Statistics for The Behavioral Sciences (MindTap C...StatisticsISBN:9781305504912Author:Frederick J Gravetter, Larry B. WallnauPublisher:Cengage Learning
 Elementary Statistics: Picturing the World (7th E...StatisticsISBN:9780134683416Author:Ron Larson, Betsy FarberPublisher:PEARSON
 The Basic Practice of StatisticsStatisticsISBN:9781319042578Author:David S. Moore, William I. Notz, Michael A. FlignerPublisher:W. H. Freeman
 Introduction to the Practice of StatisticsStatisticsISBN:9781319013387Author:David S. Moore, George P. McCabe, Bruce A. CraigPublisher:W. H. Freeman

MATLAB: An Introduction with Applications
Statistics
ISBN:9781119256830
Author:Amos Gilat
Publisher:John Wiley & Sons Inc

Probability and Statistics for Engineering and th...
Statistics
ISBN:9781305251809
Author:Jay L. Devore
Publisher:Cengage Learning

Statistics for The Behavioral Sciences (MindTap C...
Statistics
ISBN:9781305504912
Author:Frederick J Gravetter, Larry B. Wallnau
Publisher:Cengage Learning

Elementary Statistics: Picturing the World (7th E...
Statistics
ISBN:9780134683416
Author:Ron Larson, Betsy Farber
Publisher:PEARSON

The Basic Practice of Statistics
Statistics
ISBN:9781319042578
Author:David S. Moore, William I. Notz, Michael A. Fligner
Publisher:W. H. Freeman

Introduction to the Practice of Statistics
Statistics
ISBN:9781319013387
Author:David S. Moore, George P. McCabe, Bruce A. Craig
Publisher:W. H. Freeman