
ENGR.ECONOMIC ANALYSIS
14th Edition
ISBN: 9780190931919
Author: NEWNAN
Publisher: Oxford University Press
expand_more
expand_more
format_list_bulleted
Related questions
Question
- How many recessions has France undergone over the years plotted in the chart?
- What are the two biggest recessions in terms of length and magnitude?
Answer the questions from the figure given.
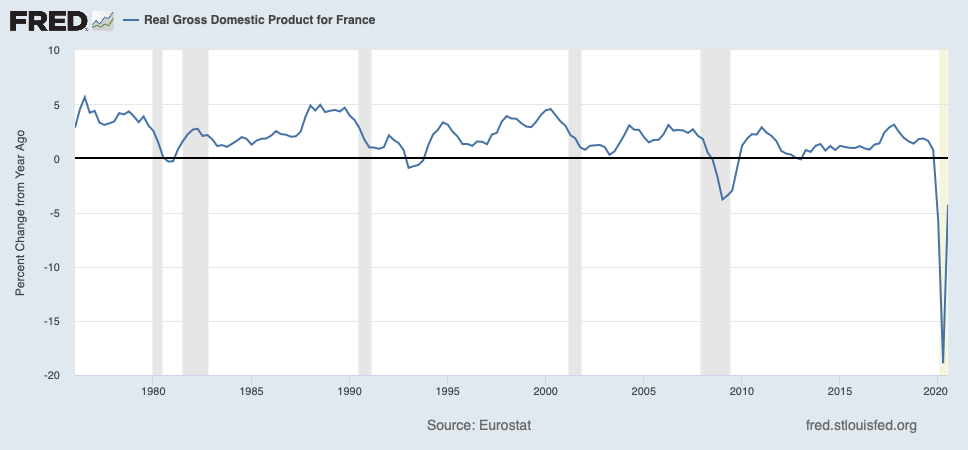

Transcribed Image Text:FRED – Real Gross Domestic Product for France
10
-5
-10
-15
-20
1980
1985
1990
1995
2000
2005
2010
2015
2020
Source: Eurostat
fred.stlouisfed.org
Percent Change from Year Ago
Expert Solution
This question has been solved!
Explore an expertly crafted, step-by-step solution for a thorough understanding of key concepts.

Step by stepSolved in 2 steps

Knowledge Booster


Learn more about
Need a deep-dive on the concept behind this application? Look no further. Learn more about this topic, economics and related others by exploring similar questions and additional content below.Similar questions
- Suppose that the annual rates of growth of real GDP of Econoland over a five-year period were as follows: Year Growth Rate 1 4% 2 28 3 -2% 4 48 5 6% What was the average of these growth rates in Econoland over these five years? Instructions: Round your answer to one decimal place. % What term would economists use to describe what happened in year 3? (Click to select) If the growth rate in year 3 had been a positive 2 percent rather than a negative 2 percent, what would have been the average growth rate? 1%arrow_forwardThe graph shows the annual growth rate of the GDP of the United States economy since the first quarter of 1990. 1. Based on the phases of the business cycle, how can you represent the concept on this graph? Explain.2. Without necessarily having the numerical data, what level (high or low) of unemployment could have been registered in some of the periods presented in the graph? Explain your answer indicating why.3. Without necessarily having the numerical data, what level (high or low) of inflation could have been registered in some of the periods presented in the graph? Explain your answer indicating why.4. How do you correlate your answers in the previous questions with the phases of economic cycles and their effects in the short and long term? Explain your answer.arrow_forwardYou are employed by the state bureau of economic development. There is a demand for a leading economic index to review past economic activity and to forecast future economic trends in the state. You decide that several key factors should be included in the index: number of new businesses started during the year, number of business failures, state income tax receipts, college enrollment, and the state sales tax receipts. Here are the data for 2000 and 2018. New businesses Business failures State income tax receipts ($ millions) College student enrollment State sales tax ($ millions) Click here for the Excel Data File Leading economic indicator 2000 1,088 Economic activity has 627 191.7 increased decreased 242,119 41.6 c. Interpret the indexes. (Round your answer to 2 decimal places.) 2018 1,162 The weights you assign are: new businesses 15%, business failures 10%, income tax 40%, enrollment 10% and sales tax 25%. b. Compute the leading economic indicator for 2018. (Round your answer to…arrow_forward
- The exports of Uruguay, a developing country, are made essentially of primary commodities. A comparison between export prices received by Uruguay and the price paid for its imports shows the following: on average export prices rose 40% between 2000 and 2010, while import prices went up by 150%. Index quantities exported by the country were Qx = 15 (in 2000), and Qx = 30 (in 2010). Uruguay’s income terms of trade (ITT) in 2000, was: Group of answer choices 100. 1,680. 2,000. 250. 1,500.arrow_forwardPlot these data points, and identify the four phases of the business cycle. Give a theory that may explain the cause of the observed business cycle. What are some of the consequences of a prolonged decline in real GDP? Is the decline in real GDP from $1,000 billion to $500 billion a recession?arrow_forwardYou are employed by the state bureau of economic development. There is a demand for a leading economic index to review past economic activity and to forecast future economic trends in the state. You decide that several key factors should be included in the index: number of new businesses started during the year, number of business failures, state income tax receipts, college enrollment, and the state sales tax receipts. Here are the data for 2000 and 2018. New businesses Business failures State income tax receipts ($ millions) College student enrollment State sales tax ($ millions) Click here for the Excel Data File Leading economic indicator The weights you assign are: new businesses 17%, business failures 10%, income tax 34%, enrollment 14% and sales tax 25%. b. Compute the leading economic indicator for 2018. (Round your answer to 2 decimal places.) 2000 1,125 592 196.2 242,159 46.1 Economic activity has 2018 1,059 286 178.8 291,079 66.7 c. Interpret the indexes. (Round your answer…arrow_forward
- Suppose you have an extra six months of data on demands and prices, in addition to the data in the example. These extra data points are (350,84), (385,72), (410,67), (400,62), (330,92), and (480,53). (The price is shown first and then the demand at that price.) After adding these points to the original data, use Excel’s Trendline tool to find the best-fitting linear, power, and exponential trend lines. Then calculate the MAPE for each of these, based on all 18 months of data. Does the power curve still have the smallest MAPE?arrow_forwardPlease answer the questions provided on the image below.arrow_forwardUse the data for the United States in this table to answer the following questions: 41 Year 2018 2019 2020 2021 2022 N Real GDP Per Capita (2012 prices) $59,607 $60,698 $58,452 $61,830 $62,867 *Real-time data provided by Federal Reserve Economic Data (FRED), Federal Reserve Bank of Saint Louis. The percentage change in real GDP per capita between 2018 and 2022 was%. (Enter your response rounded to two decimal places and include a minus sign if necessary.)arrow_forward
- The Wakandan GDP for the year 2040 was $87,000. Government expenditures were $29,000 and investment was $6,000. They exported $15,000 worth of vibranium and imported $14,000 worth of coffee beans. If these are the only relevant transactions, what is the value of government spending? Round to two decimal places. Do not enter the currency symbol, but enter the negative sign if appropriate. If your answer is -$1.125, enter -1.13. 29,000arrow_forwardAssuming the economy is currently in an expansion, which phase will follow? Then place the remaining phases of the business cycle in order = Peak = Expansion = Contraction = Trougharrow_forwardStatistics Denmark monitors the development of economic variables and measures e.g. productivity development.In general, it is one of the laws of economics that employee productivity determines the ability of employers to pay employees wages. The higher the productivity (per capita output), the higher the wages that can be paid. In a recession, such as Covid, companies are generally reducing their use of labor. The latest statistics show the following: In the third quarter of 2020, labor productivity growth in Denmark was 2%. This increase alone does not say much, but is considered to be able to reflect an increase in productivity following a contraction in labor input. a. Show the relationship between production and labor use in the short term and at the same time explain with a picture what can cause the growth of productivity. b. What is happening to marginal production at the same time? c. Show how wages develop if companies keep marginal costs fixed in the above circumstances…arrow_forward
arrow_back_ios
SEE MORE QUESTIONS
arrow_forward_ios
Recommended textbooks for you
 Principles of Economics (12th Edition)EconomicsISBN:9780134078779Author:Karl E. Case, Ray C. Fair, Sharon E. OsterPublisher:PEARSON
 Engineering Economy (17th Edition)EconomicsISBN:9780134870069Author:William G. Sullivan, Elin M. Wicks, C. Patrick KoellingPublisher:PEARSON
 Principles of Economics (MindTap Course List)EconomicsISBN:9781305585126Author:N. Gregory MankiwPublisher:Cengage Learning
 Managerial Economics: A Problem Solving ApproachEconomicsISBN:9781337106665Author:Luke M. Froeb, Brian T. McCann, Michael R. Ward, Mike ShorPublisher:Cengage Learning
 Managerial Economics & Business Strategy (Mcgraw-...EconomicsISBN:9781259290619Author:Michael Baye, Jeff PrincePublisher:McGraw-Hill Education
Principles of Economics (12th Edition)
Economics
ISBN:9780134078779
Author:Karl E. Case, Ray C. Fair, Sharon E. Oster
Publisher:PEARSON
Engineering Economy (17th Edition)
Economics
ISBN:9780134870069
Author:William G. Sullivan, Elin M. Wicks, C. Patrick Koelling
Publisher:PEARSON
Principles of Economics (MindTap Course List)
Economics
ISBN:9781305585126
Author:N. Gregory Mankiw
Publisher:Cengage Learning
Managerial Economics: A Problem Solving Approach
Economics
ISBN:9781337106665
Author:Luke M. Froeb, Brian T. McCann, Michael R. Ward, Mike Shor
Publisher:Cengage Learning
Managerial Economics & Business Strategy (Mcgraw-...
Economics
ISBN:9781259290619
Author:Michael Baye, Jeff Prince
Publisher:McGraw-Hill Education