
MATLAB: An Introduction with Applications
6th Edition
ISBN: 9781119256830
Author: Amos Gilat
Publisher: John Wiley & Sons Inc
expand_more
expand_more
format_list_bulleted
Related questions
Question
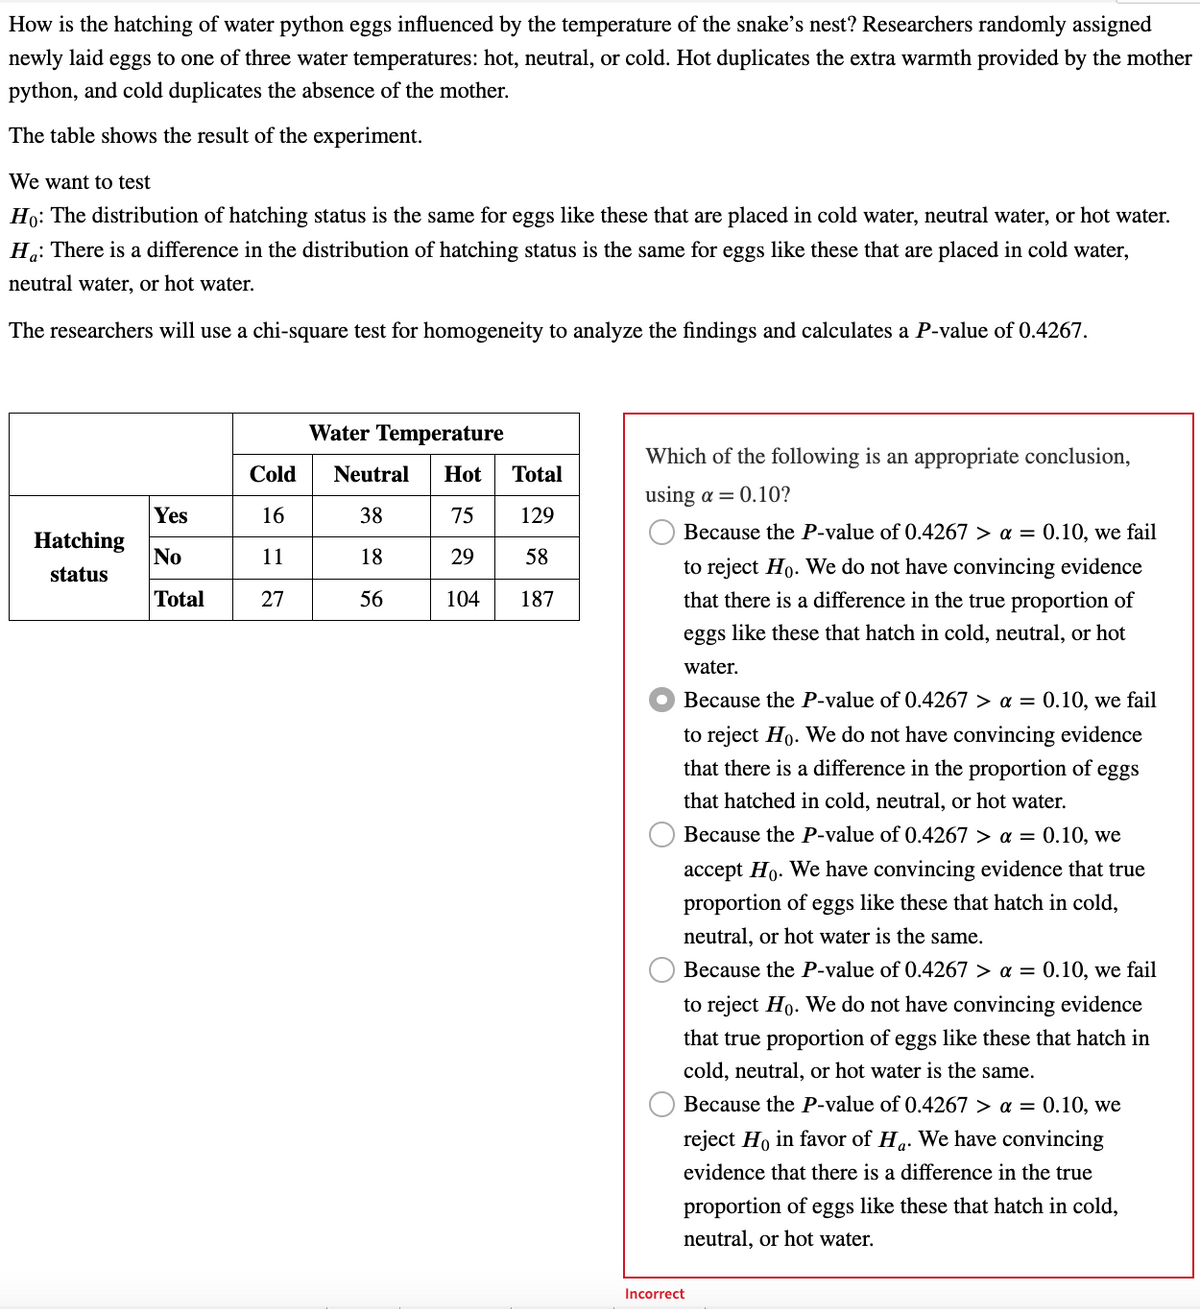

Transcribed Image Text:How is the hatching of water python eggs influenced by the temperature of the snake's nest? Researchers randomly assigned
newly laid eggs to one of three water temperatures: hot, neutral, or cold. Hot duplicates the extra warmth provided by the mother
python, and cold duplicates the absence of the mother.
The table shows the result of the experiment.
We want to test
Ho: The distribution of hatching status is the same for eggs like these that are placed in cold water, neutral water, or hot water.
Ha: There is a difference in the distribution of hatching status is the same for eggs like these that are placed in cold water,
neutral water, or hot water.
The researchers will use a chi-square test for homogeneity to analyze the findings and calculates a P-value of 0.4267.
Hatching
status
Yes
No
Total
Cold
16
11
27
Water Temperature
Neutral Hot
38
75
18
29
56
104
Total
129
58
187
Which of the following is an appropriate conclusion,
using a = 0.10?
O
Because the P-value of 0.4267 > a = 0.10, we fail
to reject Ho. We do not have convincing evidence
that there is a difference in the true proportion of
eggs like these that hatch in cold, neutral, or hot
water.
Because the P-value of 0.4267 > a = 0.10, we fail
to reject Ho. We do not have convincing evidence
that there is a difference in the proportion of eggs
that hatched in cold, neutral, or hot water.
Because the P-value of 0.4267> a = 0.10, we
accept Ho. We have convincing evidence that true
proportion of eggs like these that hatch in cold,
neutral, or hot water is the same.
Because the P-value of 0.4267 > a = 0.10, we fail
to reject Ho. We do not have convincing evidence
that true proportion of eggs like these that hatch in
cold, neutral, or hot water is the same.
Because the P-value of 0.4267> a = 0.10, we
reject Ho in favor of Ha. We have convincing
evidence that there is a difference in the true
proportion of eggs like these that hatch in cold,
neutral, or hot water.
Incorrect
Expert Solution
This question has been solved!
Explore an expertly crafted, step-by-step solution for a thorough understanding of key concepts.

This is a popular solution

Trending nowThis is a popular solution!

Step by stepSolved in 3 steps

Knowledge Booster

Similar questions
- Dr. Mackintosh believes a new olfactory therapy would be more successful in promoting weight loss among obese patients. His patients are first weighed and then randomly assigned to olfactory therapy, dance therapy, or a control condition. At the end of the three weeks, the amount of weight lost is recorded. The results indicate no significant difference in the amount of weight lost between the three conditions. Identify the independent variable along with each level and the dependent variable.arrow_forwardThe director of student services at Oxnard College is interested in whether women are just as likely to attend orientation as men before they begin their coursework. A random sample of freshmen at Oxnard College were asked what their gender is and whether they attended orientation. The results of the survey are shown below: Data for Gender vs. Orientation Attendance Women Men Yes 440 410 No 238 239 What can be conduded at the a - 0.10 level of significance? For this study, we should use z-test for a population proportion a. The null and alternative hypotheses would be: Ho: Select an answer v Select an answer v Select an answer v (please enter a decimal and note that p1 and ul represent the proportion and mean women and and u2 represent proportion and mean for men.) H: Select an answer v Select an answer v Select an answer v (Please enter a decimal) b. The test statistic ? v (please show your answer to 3 decimal places.) c. The p-value = (Please show your answer to 4 decimal places.) d.…arrow_forwardPart 1 of 4 A doctor in Oklahoma City wants to know whether the average life span for heart disease patients at four hospitals in the city differ. The data below represents the life span, in years, of heart disease patients from each hospital. Perform an ANOVA test with a 10% level of significance to test whether the average life span of heart disease patients in Oklahoma City differs depending on the hospital that treats them Life Span of Patients Treated at Hospital 1: 8.1, 1.2, 7, 11.5, 21, 2, 15.3, 19.2, 10.5, 15.4, 12.7, 15.3, 12.1, 7.5, 11.4, 16.4, 26.7, 14.6, 1.5, 16.3, 12.6, 0.8, 18.2, 4.2, 9.6, 21, 16.3, 2.7 Life Span of Patients Treated at Hospital 2: 17.6, 11.6, 16.8, 5.2, 6.7, 3.2, 13.8, 12.5, 0.9, 6, 14.3, 1.8, 14.8, 10, 5.8, 15.2, 10, 3.7, 11.4, 21.6, 12.9, 0.5, 9.2, 13.9, 10.9 Life Span of Patients Treated at Hospital 3: 8.5, 2.3, 11, 7.4, 14.8, 5.8, 11, 3.4, 10.9, 1.1, 5.9, 21.6, 12.5, 0.1, 15.5, 15.4, 0.8, 7.7, 5.6, 12, 7.1 Life Span of Patients Treated at Hospital 4:…arrow_forward
- A science project involves testing the effects of different types of music on plant growth. A sample of 24 newly sprouted bean plants is obtained. The plants are randomly assigned to each experimental condition (6 per group). The experimental conditions are: rock music, heavy metal, country, and classical. The dependent variable is the height of each plant after 2 weeks. The ANOVA results are summarized as follows: MSB = 10 and SSW =40. Construct a summary table for this studyarrow_forwardMicah is interested in testing whether college students' levels of gratitude change over the course of the semester. He randomly selects a sample of 100 students and assesses their levels of gratitude at the beginning, and end of the semester. Question 17 options: ANOVA Paired samples t test Independent samples t test Correlationarrow_forwardA test is being designed to compare the wearing quality of two brands of tires, say brand A and brand B. Six automobiles will be selected and equipped with the new tires from both brands and driven under normal conditions for 1 month. A measurement will be taken to determine how much wear took place on a scale from 0 to 200. Below is a table of the paired data collected from the 6 cars in the test. [BrandA BrandB] 125 64 64 65 94 103 38 37 90 102 106 115 Conduct a hypothesis test to determine whether the mean of the difference population is 0 at a significance level of a =. State your conclusion.arrow_forward
- (OPHTHALMOLOGY) The following data are from a study on Botox injections. Patients received a high-dose injection in one eye (experimental treatment = treatment E) and a low-dose injection in the other eye (control treatment = treatment C). Patients were asked to rate the level of pain in each eye on a 1–10 scale, with higher scores indicating more pain. The assignment of treatments to eyes was randomized. The subjects came back over several visits. Data from the last visit are given in the following table: 1. Which of the following is the correct test to conduct given the situation above? 2. The hypotheses are: 3. What is the level of significance? 4. What is the computed test statistic? Hint: Use (mean of "Pain in E eye") minus (mean of "Pain in C eye") 5. What is the correct decision based on the p-value or critical value method?arrow_forwardPls help ASAP. Pls show all work.arrow_forward
arrow_back_ios
arrow_forward_ios
Recommended textbooks for you
- MATLAB: An Introduction with ApplicationsStatisticsISBN:9781119256830Author:Amos GilatPublisher:John Wiley & Sons Inc
 Probability and Statistics for Engineering and th...StatisticsISBN:9781305251809Author:Jay L. DevorePublisher:Cengage Learning
 Statistics for The Behavioral Sciences (MindTap C...StatisticsISBN:9781305504912Author:Frederick J Gravetter, Larry B. WallnauPublisher:Cengage Learning
  Elementary Statistics: Picturing the World (7th E...StatisticsISBN:9780134683416Author:Ron Larson, Betsy FarberPublisher:PEARSON
 The Basic Practice of StatisticsStatisticsISBN:9781319042578Author:David S. Moore, William I. Notz, Michael A. FlignerPublisher:W. H. Freeman
 Introduction to the Practice of StatisticsStatisticsISBN:9781319013387Author:David S. Moore, George P. McCabe, Bruce A. CraigPublisher:W. H. Freeman
MATLAB: An Introduction with Applications
Statistics
ISBN:9781119256830
Author:Amos Gilat
Publisher:John Wiley & Sons Inc
Probability and Statistics for Engineering and th...
Statistics
ISBN:9781305251809
Author:Jay L. Devore
Publisher:Cengage Learning
Statistics for The Behavioral Sciences (MindTap C...
Statistics
ISBN:9781305504912
Author:Frederick J Gravetter, Larry B. Wallnau
Publisher:Cengage Learning
Elementary Statistics: Picturing the World (7th E...
Statistics
ISBN:9780134683416
Author:Ron Larson, Betsy Farber
Publisher:PEARSON
The Basic Practice of Statistics
Statistics
ISBN:9781319042578
Author:David S. Moore, William I. Notz, Michael A. Fligner
Publisher:W. H. Freeman
Introduction to the Practice of Statistics
Statistics
ISBN:9781319013387
Author:David S. Moore, George P. McCabe, Bruce A. Craig
Publisher:W. H. Freeman