
MATLAB: An Introduction with Applications
6th Edition
ISBN: 9781119256830
Author: Amos Gilat
Publisher: John Wiley & Sons Inc
expand_more
expand_more
format_list_bulleted
Related questions
Question
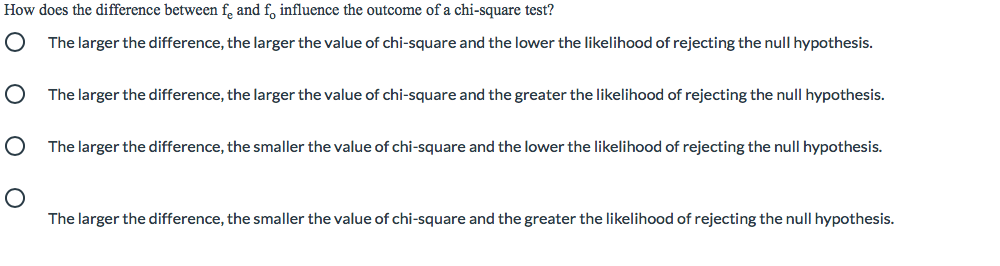

Transcribed Image Text:How does the difference between f, and f, influence the outcome of a chi-square test?
The larger the difference, the larger the value of chi-square and the lower the likelihood of rejecting the null hypothesis.
The larger the difference, the larger the value of chi-square and the greater the likelihood of rejecting the null hypothesis.
The larger the difference, the smaller the value of chi-square and the lower the likelihood of rejecting the null hypothesis.
The larger the difference, the smaller the value of chi-square and the greater the likelihood of rejecting the null hypothesis.
Expert Solution
This question has been solved!
Explore an expertly crafted, step-by-step solution for a thorough understanding of key concepts.

This is a popular solution

Trending nowThis is a popular solution!

Step by stepSolved in 2 steps with 2 images

Knowledge Booster

Similar questions
- The following table contains the number of successes and failures for three categories of a variable. Test whether the proportions are equal for each category at the α=0.1 level of significance. Category 1 Category 2 Category 3 Failures 32 51 57 Successes 39 54 73 State the hypotheses. Choose the correct answer below. A. H0: The categories of the variable and success and failure are independent. H1: The categories of the variable and success and failure are dependent. B. H0: The categories of the variable and success and failure are dependent. H1: The categories of the variable and success and failure are independent. C. H0: p1=p2=p3 H1: At least one of the proportions is different from the others. D. H0: μ1=E1 and μ2=E2 and μ3=E3 H1: At least one mean is different from what is expected. What is the P-value? nothing (Round to three decimal places as needed.) What conclusion can be…arrow_forwardIt has recently been claimed that 25% of adults consider spring to be their favorite season of the year. A researcher is skeptical of this claim and believes this percentage is too low. She surveys a random of 1,000 adults and finds that 390 of these adults consider spring to be their favorite season of the year. As she prepares to conduct a hypothesis test, the researcher writes out her alternative hypothesis as “p < 0.25.” What is wrong with this? The alternative hypothesis should be “p > 0.39.” The alternative hypothesis should be “p < 0.39.” The alternative hypothesis should be “p > 0.25.” The alternative hypothesis should be “p = 0.25.” Nothing is wrong with the given alternative hypothesis.arrow_forwardbased on these findings, at least two hypotheses that you are testing in this project. Your hypotheses can have the same dependent variable, but they should have different independent variables. (Happiness and physical healtharrow_forward
- Question 9 Dr. Jameson wanted to know if IQ scores differed between male and female participants in his study. He gave 28 participants an IQ test and then compared IQ scores for gender differences. He hypothesized that there would be a statistically significant gender difference in IQ scores. Contrary to Dr. Jameson's hypothesis, there were no differences in IQ scores between men and women in his study. From the results of the study, Dr. Jameson must the research hypothesis. the null hypothesis and fail to reject; reject reject; retest reject; fail to reject retest; rejectarrow_forwardFill in the Blank Question 3 If one or more of the relevant predictor variables are excluded, then the resulting OLS estimators are biased. The extent of the bias depends on the degree of the between the included and the excluded predictor variables.arrow_forwardA local coach wants to see if training in light rooms or dark rooms impacts athlete performance. With the single team, the coach tries training in different conditions and takes measurements. She ran her analysis in Microsoft Excel and received the following output table. If the P value is less than 0.05, the null hypothesis may be rejected. Based on the data table, what decision should the coach make about the hypothesis? Coach should reject the null hypothesis. Coach should fail to reject the null hypothesis. Coach should accept the null hypothesis. Coach does not have enough information to decide.arrow_forward
- #11). Both pictures are the same question. Need help with it.arrow_forwardYou wish to test whether a particular drug manages to bring body temperature down. So, you conduct a pilot study where 47 people receive the drug, and 45 people receive a placebo. The body temperatures of patients from the treatment group are group 1 (variable X1); those from the placebo group are group 2 (variable X2). What is the research hypothesis? mu1 > mu2 mu1 ≠ mu2 mu1 < mu2 mu1 = mu2arrow_forwardA decade-old study found that the proportion of high school seniors who felt that "getting rich" was an important personal goal was 68%. Suppose that we have reason to believe that this proportion has changed, and we wish to carry out a hypothesis test to see if our belief can be supported. State the null hypothesis H, and the alternative hypothesis H that we would use for this test. H: 0 Oarrow_forward
- This is the step1, so step 2 and step 3 must be answered. (Step 2: Test Statistic -Pearson's r correlation coefficient AND Step 3: Critical Values ) so based it from the photo. Show COMPLETE SOLUTIONS. The table shows the number of hours spend by 30 students in studing and their test scores. Solve for the Pearson’s r and interpret the results. Use 5% significance level. Step 1: Null and Alternative Hypothesis Ho: r = 0; There is no significant relationship between the number of hours spent studying and the students test scores. Ha: r ≠ 0; There is a significant relationship between the number of hours spent studying and the students test scores.arrow_forwardUSE THE 8-STEP HYPOTHESIS TESTING Refer to the study by Carter et al. [A-9], who investigated the effect of age at onset of bipolar disorder on the course of the illness. One of the variables studied was subjects' family history. Table 3.4.1 shows the frequency of a family history of mood disorders in the two groups of interest: early age at onset (18 years or younger) and later age at onset (later than 18 years). Family History of Mood Disorders Early ≤ 18(E) 28 19 41 53 Later > 18 (L) 35 38 44 60 141 Total 63 57 85 113 Negative (A) Bipolar disorder (B) Unipolar (C) Unipolar and bipolar (D) Total 177 318 Source: Tasha D. Carter, Emanuela Mundo, Sagar V. Parkh, and James L. Kennedy, "Early Age at Onset as a Risk Factor for Poor Outcome of Bipolar Disorder," Journal of Psychiatric Research, 37 (2003), 297-303. Can we conclude on the basis of these data that subjects 18 or younger differ from subjects older than 18 with respect to family histories of mood disorders? Let a = .05.arrow_forward
arrow_back_ios
arrow_forward_ios
Recommended textbooks for you
- MATLAB: An Introduction with ApplicationsStatisticsISBN:9781119256830Author:Amos GilatPublisher:John Wiley & Sons Inc
 Probability and Statistics for Engineering and th...StatisticsISBN:9781305251809Author:Jay L. DevorePublisher:Cengage Learning
 Statistics for The Behavioral Sciences (MindTap C...StatisticsISBN:9781305504912Author:Frederick J Gravetter, Larry B. WallnauPublisher:Cengage Learning
  Elementary Statistics: Picturing the World (7th E...StatisticsISBN:9780134683416Author:Ron Larson, Betsy FarberPublisher:PEARSON
 The Basic Practice of StatisticsStatisticsISBN:9781319042578Author:David S. Moore, William I. Notz, Michael A. FlignerPublisher:W. H. Freeman
 Introduction to the Practice of StatisticsStatisticsISBN:9781319013387Author:David S. Moore, George P. McCabe, Bruce A. CraigPublisher:W. H. Freeman
MATLAB: An Introduction with Applications
Statistics
ISBN:9781119256830
Author:Amos Gilat
Publisher:John Wiley & Sons Inc
Probability and Statistics for Engineering and th...
Statistics
ISBN:9781305251809
Author:Jay L. Devore
Publisher:Cengage Learning
Statistics for The Behavioral Sciences (MindTap C...
Statistics
ISBN:9781305504912
Author:Frederick J Gravetter, Larry B. Wallnau
Publisher:Cengage Learning
Elementary Statistics: Picturing the World (7th E...
Statistics
ISBN:9780134683416
Author:Ron Larson, Betsy Farber
Publisher:PEARSON
The Basic Practice of Statistics
Statistics
ISBN:9781319042578
Author:David S. Moore, William I. Notz, Michael A. Fligner
Publisher:W. H. Freeman
Introduction to the Practice of Statistics
Statistics
ISBN:9781319013387
Author:David S. Moore, George P. McCabe, Bruce A. Craig
Publisher:W. H. Freeman